Version 1.2.0.RELEASE
© 2012-2017 Pivotal Software, Inc.
Copies of this document may be made for your own use and for distribution to others, provided that you do not charge any fee for such copies and further provided that each copy contains this Copyright Notice, whether distributed in print or electronically.
Introduction
1. Introducing Spring Cloud Data Flow for Kubernetes
Spring Cloud Data Flow is a toolkit for building data integration and real-time data processing pipelines.
Pipelines consist of Spring Boot apps, built using the Spring Cloud Stream or Spring Cloud Task microservice frameworks. This makes Spring Cloud Data Flow suitable for a range of data processing use cases, from import/export to event streaming and predictive analytics.
This project provides support for using Spring Cloud Data Flow with Kubernetes as the runtime for these pipelines with apps packaged as Docker images.
2. Spring Cloud Data Flow
Spring Cloud Data Flow is a cloud-native orchestration service for composable data microservices on modern runtimes. With Spring Cloud Data Flow, developers can create and orchestrate data pipelines for common use cases such as data ingest, real-time analytics, and data import/export.
The Spring Cloud Data Flow architecture consists of a server that deploys Streams and Tasks. Streams are defined using a DSL or visually through the browser based designer UI. Streams are based on the Spring Cloud Stream programming model while Tasks are based on the Spring Cloud Task programming model. The sections below describe more information about creating your own custom Streams and Tasks
For more details about the core architecture components and the supported features, please review Spring Cloud Data Flow’s core reference guide. There’re several samples available for reference.
3. Spring Cloud Stream
Spring Cloud Stream is a framework for building message-driven microservice applications. Spring Cloud Stream builds upon Spring Boot to create standalone, production-grade Spring applications, and uses Spring Integration to provide connectivity to message brokers. It provides opinionated configuration of middleware from several vendors, introducing the concepts of persistent publish-subscribe semantics, consumer groups, and partitions.
For more details about the core framework components and the supported features, please review Spring Cloud Stream’s reference guide.
There’s a rich ecosystem of Spring Cloud Stream Application-Starters that can be used either as standalone data microservice applications or in Spring Cloud Data Flow. For convenience, we have generated RabbitMQ and Apache Kafka variants of these application-starters that are available for use from Docker Hub as docker images.
Do you have a requirement to develop custom applications? No problem. Refer to this guide to create custom stream applications. There’re several samples available for reference.
4. Spring Cloud Task
Spring Cloud Task makes it easy to create short-lived microservices. We provide capabilities that allow short-lived JVM processes to be executed on demand in a production environment.
For more details about the core framework components and the supported features, please review Spring Cloud Task’s reference guide.
There’s a rich ecosystem of Spring Cloud Task Application-Starters that can be used either as standalone data microservice applications or in Spring Cloud Data Flow. For convenience, the generated application-starters are available for use from Docker Hub as docker images. There are several samples available for reference.
Architecture
5. Introduction
Spring Cloud Data Flow simplifies the development and deployment of applications focused on data processing use-cases. The major concepts of the architecture are Applications, the Data Flow Server, and the target runtime.
Applications come in two flavors
-
Long lived Stream applications where an unbounded amount of data is consumed or produced via messaging middleware.
-
Short lived Task applications that process a finite set of data and then terminate.
Depending on the runtime, applications can be packaged in two ways
-
Spring Boot uber-jar that is hosted in a maven repository, file, http or any other Spring resource implementation.
-
Docker
The runtime is the place where applications execute. The target runtimes for applications are platforms that you may already be using for other application deployments.
The supported runtimes are
-
Cloud Foundry
-
Apache YARN
-
Kubernetes
-
Apache Mesos
-
Local Server for development
There is a deployer Service Provider Interface (SPI) that enables you to extend Data Flow to deploy onto other runtimes, for example to support Docker Swarm. There are community implementations of Hashicorp’s Nomad and RedHat Openshift is available. We look forward to working with the community for further contributions!
The component that is responsible for deploying applications to a runtime is the Data Flow Server. There is a Data Flow Server executable jar provided for each of the target runtimes. The Data Flow server is responsible for interpreting
-
A stream DSL that describes the logical flow of data through multiple applications.
-
A deployment manifest that describes the mapping of applications onto the runtime. For example, to set the initial number of instances, memory requirements, and data partitioning.
As an example, the DSL to describe the flow of data from an http source to an Apache Cassandra sink would be written as “http | cassandra”. These names in the DSL are registered with the Data Flow Server and map onto application artifacts that can be hosted in Maven or Docker repositories. Many source, processor, and sink applications for common use-cases (e.g. jdbc, hdfs, http, router) are provided by the Spring Cloud Data Flow team. The pipe symbol represents the communication between the two applications via messaging middleware. The two messaging middleware brokers that are supported are
-
Apache Kafka
-
RabbitMQ
In the case of Kafka, when deploying the stream, the Data Flow server is responsible to create the topics that correspond to each pipe symbol and configure each application to produce or consume from the topics so the desired flow of data is achieved.
The interaction of the main components is shown below
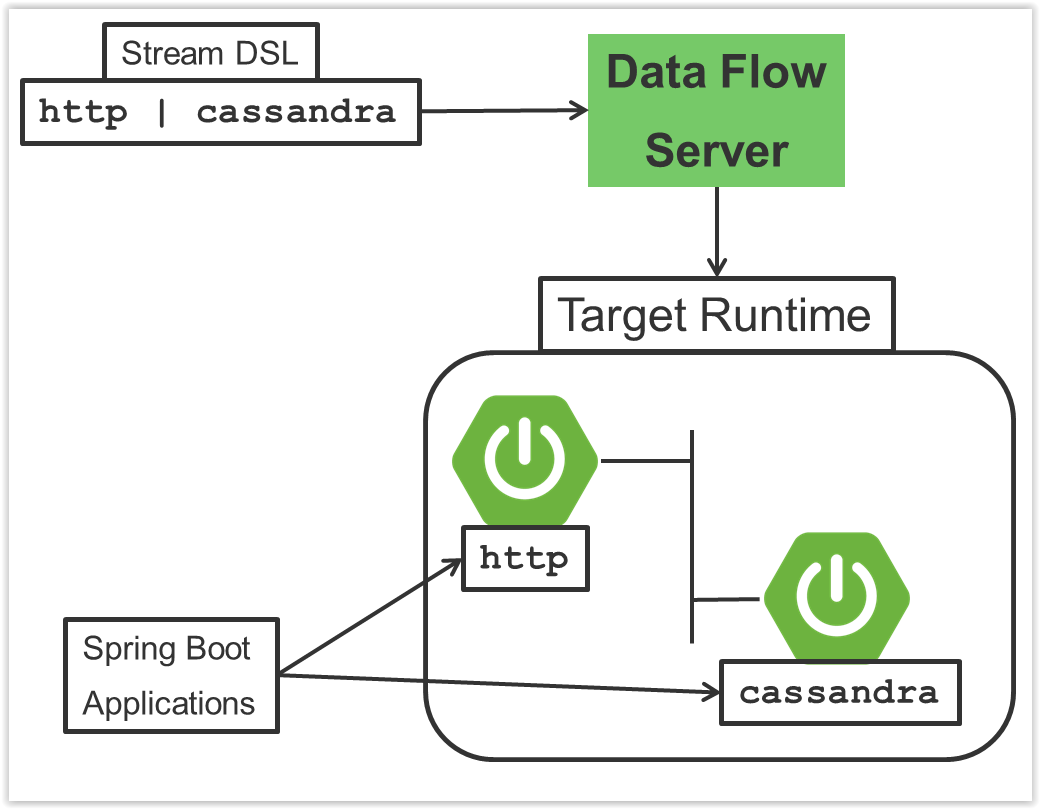
In this diagram a DSL description of a stream is POSTed to the Data Flow Server. Based on the mapping of DSL application names to Maven and Docker artifacts, the http-source and cassandra-sink applications are deployed on the target runtime.
6. Microservice Architectural Style
The Data Flow Server deploys applications onto the target runtime that conform to the microservice architectural style. For example, a stream represents a high level application that consists of multiple small microservice applications each running in their own process. Each microservice application can be scaled up or down independent of the other and each has their own versioning lifecycle.
Both Streaming and Task based microservice applications build upon Spring Boot as the foundational library. This gives all microservice applications functionality such as health checks, security, configurable logging, monitoring and management functionality, as well as executable JAR packaging.
It is important to emphasise that these microservice applications are ‘just apps’ that you can run by yourself using ‘java -jar’ and passing in appropriate configuration properties. We provide many common microservice applications for common operations so you don’t have to start from scratch when addressing common use-cases which build upon the rich ecosystem of Spring Projects, e.g Spring Integration, Spring Data, Spring Hadoop and Spring Batch. Creating your own microservice application is similar to creating other Spring Boot applications, you can start using the Spring Initialzr web site or the UI to create the basic scaffolding of either a Stream or Task based microservice.
In addition to passing in the appropriate configuration to the applications, the Data Flow server is responsible for preparing the target platform’s infrastructure so that the application can be deployed. For example, in Cloud Foundry it would be binding specified services to the applications and executing the ‘cf push’ command for each application. For Kubernetes it would be creating the replication controller, service, and load balancer.
The Data Flow Server helps simplify the deployment of multiple applications onto a target runtime, but one could also opt to deploy each of the microservice applications manually and not use Data Flow at all. This approach might be more appropriate to start out with for small scale deployments, gradually adopting the convenience and consistency of Data Flow as you develop more applications. Manual deployment of Stream and Task based microservices is also a useful educational exercise that will help you better understand some of the automatic applications configuration and platform targeting steps that the Data Flow Server provides.
6.1. Comparison to other Platform architectures
Spring Cloud Data Flow’s architectural style is different than other Stream and Batch processing platforms. For example in Apache Spark, Apache Flink, and Google Cloud Dataflow applications run on a dedicated compute engine cluster. The nature of the compute engine gives these platforms a richer environment for performing complex calculations on the data as compared to Spring Cloud Data Flow, but it introduces complexity of another execution environment that is often not needed when creating data centric applications. That doesn’t mean you cannot do real time data computations when using Spring Cloud Data Flow. Refer to the analytics section which describes the integration of Redis to handle common counting based use-cases as well as the RxJava integration for functional API driven analytics use-cases, such as time-sliding-window and moving-average among others.
Similarly, Apache Storm, Hortonworks DataFlow and Spring Cloud Data Flow’s predecessor, Spring XD, use a dedicated application execution cluster, unique to each product, that determines where your code should execute on the cluster and perform health checks to ensure that long lived applications are restarted if they fail. Often, framework specific interfaces are required to be used in order to correctly “plug in” to the cluster’s execution framework.
As we discovered during the evolution of Spring XD, the rise of multiple container frameworks in 2015 made creating our own runtime a duplication of efforts. There is no reason to build your own resource management mechanics, when there are multiple runtime platforms that offer this functionality already. Taking these considerations into account is what made us shift to the current architecture where we delegate the execution to popular runtimes, runtimes that you may already be using for other purposes. This is an advantage in that it reduces the cognitive distance for creating and managing data centric applications as many of the same skills used for deploying other end-user/web applications are applicable.
7. Streaming Applications
While Spring Boot provides the foundation for creating DevOps friendly microservice applications, other libraries in the Spring ecosystem help create Stream based microservice applications. The most important of these is Spring Cloud Stream.
The essence of the Spring Cloud Stream programming model is to provide an easy way to describe multiple inputs and outputs of an application that communicate over messaging middleware. These input and outputs map onto Kafka topics or Rabbit exchanges and queues. Common application configuration for a Source that generates data, a Process that consumes and produces data and a Sink that consumes data is provided as part of the library.
7.1. Imperative Programming Model
Spring Cloud Stream is most closely integrated with Spring Integration’s imperative "event at a time" programming model. This means you write code that handles a single event callback. For example,
@EnableBinding(Sink.class)
public class LoggingSink {

    @StreamListener(Sink.INPUT)
    public void log(String message) {
        System.out.println(message);
    }
}
In this case the String payload of a message coming on the input channel, is handed to the log method. The @EnableBinding annotation is what is used to tie together the input channel to the external middleware.
7.2. Functional Programming Model
However, Spring Cloud Stream can support other programming styles. The use of reactive APIs where incoming and outgoing data is handled as continuous data flows and it defines how each individual message should be handled. You can also use operators that describe functional transformations from inbound to outbound data flows. The upcoming versions will support Apache Kafka’s KStream API in the programming model.
8. Streams
8.1. Topologies
The Stream DSL describes linear sequences of data flowing through the system. For example, in the stream definition http | transformer | cassandra, each pipe symbol connects the application on the left to the one on the right. Named channels can be used for routing and to fan out data to multiple messaging destinations.
Taps can be used to ‘listen in’ to the data that if flowing across any of the pipe symbols. Taps can be used as sources for new streams with an in independent life cycle.
8.2. Concurrency
For an application that will consume events, Spring Cloud stream exposes a concurrency setting that controls the size of a thread pool used for dispatching incoming messages. See the Consumer properties documentation for more information.
8.3. Partitioning
A common pattern in stream processing is to partition the data as it moves from one application to the next. Partitioning is a critical concept in stateful processing, for either performance or consistency reasons, to ensure that all related data is processed together. For example, in a time-windowed average calculation example, it is important that all measurements from any given sensor are processed by the same application instance. Alternatively, you may want to cache some data related to the incoming events so that it can be enriched without making a remote procedure call to retrieve the related data.
Spring Cloud Data Flow supports partitioning by configuring Spring Cloud Stream’s output and input bindings. Spring Cloud Stream provides a common abstraction for implementing partitioned processing use cases in a uniform fashion across different types of middleware. Partitioning can thus be used whether the broker itself is naturally partitioned (e.g., Kafka topics) or not (e.g., RabbitMQ). The following image shows how data could be partitioned into two buckets, such that each instance of the average processor application consumes a unique set of data.
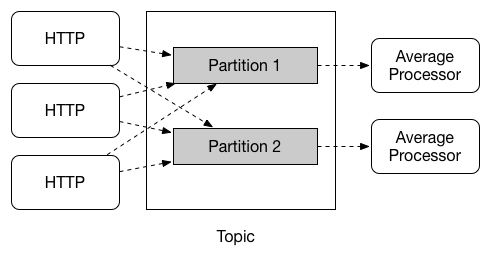
To use a simple partitioning strategy in Spring Cloud Data Flow, you only need set the instance count for each application in the stream and a partitionKeyExpression producer property when deploying the stream. The partitionKeyExpression identifies what part of the message will be used as the key to partition data in the underlying middleware. An ingest stream can be defined as http | averageprocessor | cassandra (Note that the Cassandra sink isn’t shown in the diagram above). Suppose the payload being sent to the http source was in JSON format and had a field called sensorId. Deploying the stream with the shell command stream deploy ingest --propertiesFile ingestStream.properties where the contents of the file ingestStream.properties are
deployer.http.count=3
deployer.averageprocessor.count=2
app.http.producer.partitionKeyExpression=payload.sensorId
will deploy the stream such that all the input and output destinations are configured for data to flow through the applications but also ensure that a unique set of data is always delivered to each averageprocessor instance. In this case the default algorithm is to evaluate payload.sensorId % partitionCount where the partitionCount is the application count in the case of RabbitMQ and the partition count of the topic in the case of Kafka.
Please refer to [passing_stream_partition_properties] for additional strategies to partition streams during deployment and how they map onto the underlying Spring Cloud Stream Partitioning properties.
Also note, that you can’t currently scale partitioned streams. Read the section Scaling at runtime for more information.
8.4. Message Delivery Guarantees
Streams are composed of applications that use the Spring Cloud Stream library as the basis for communicating with the underlying messaging middleware product. Spring Cloud Stream also provides an opinionated configuration of middleware from several vendors, in particular providing persistent publish-subscribe semantics.
The Binder abstraction in Spring Cloud Stream is what connects the application to the middleware. There are several configuration properties of the binder that are portable across all binder implementations and some that are specific to the middleware.
For consumer applications there is a retry policy for exceptions generated during message handling. The retry policy is configured using the common consumer properties maxAttempts, backOffInitialInterval, backOffMaxInterval, and backOffMultiplier. The default values of these properties will retry the callback method invocation 3 times and wait one second for the first retry. A backoff multiplier of 2 is used for the second and third attempts.
When the number of retry attempts has exceeded the maxAttempts value, the exception and the failed message will become the payload of a message and be sent to the application’s error channel. By default, the default message handler for this error channel logs the message. You can change the default behavior in your application by creating your own message handler that subscribes to the error channel.
Spring Cloud Stream also supports a configuration option for both Kafka and RabbitMQ binder implementations that will send the failed message and stack trace to a dead letter queue. The dead letter queue is a destination and its nature depends on the messaging middleware (e.g in the case of Kafka it is a dedicated topic). To enable this for RabbitMQ set the consumer properties republishtoDlq and autoBindDlq and the producer property autoBindDlq to true when deploying the stream. To always apply these producer and consumer properties when deploying streams, configure them as common application properties when starting the Data Flow server.
Additional messaging delivery guarantees are those provided by the underlying messaging middleware that is chosen for the application for both producing and consuming applications. Refer to the Kafka Consumer and Producer and Rabbit Consumer and Producer documentation for more details. You will find extensive declarative support for all the native QOS options.
9. Analytics
Spring Cloud Data Flow is aware of certain Sink applications that will write counter data to Redis and provides an REST endpoint to read counter data. The types of counters supported are
-
Counter - Counts the number of messages it receives, optionally storing counts in a separate store such as redis.
-
Field Value Counter - Counts occurrences of unique values for a named field in a message payload
-
Aggregate Counter - Stores total counts but also retains the total count values for each minute, hour day and month.
It is important to note that the timestamp that is used in the aggregate counter can come from a field in the message itself so that out of order messages are properly accounted.
10. Task Applications
The Spring Cloud Task programming model provides:
-
Persistence of the Task’s lifecycle events and exit code status.
-
Lifecycle hooks to execute code before or after a task execution.
-
Emit task events to a stream (as a source) during the task lifecycle.
-
Integration with Spring Batch Jobs.
11. Data Flow Server
11.1. Endpoints
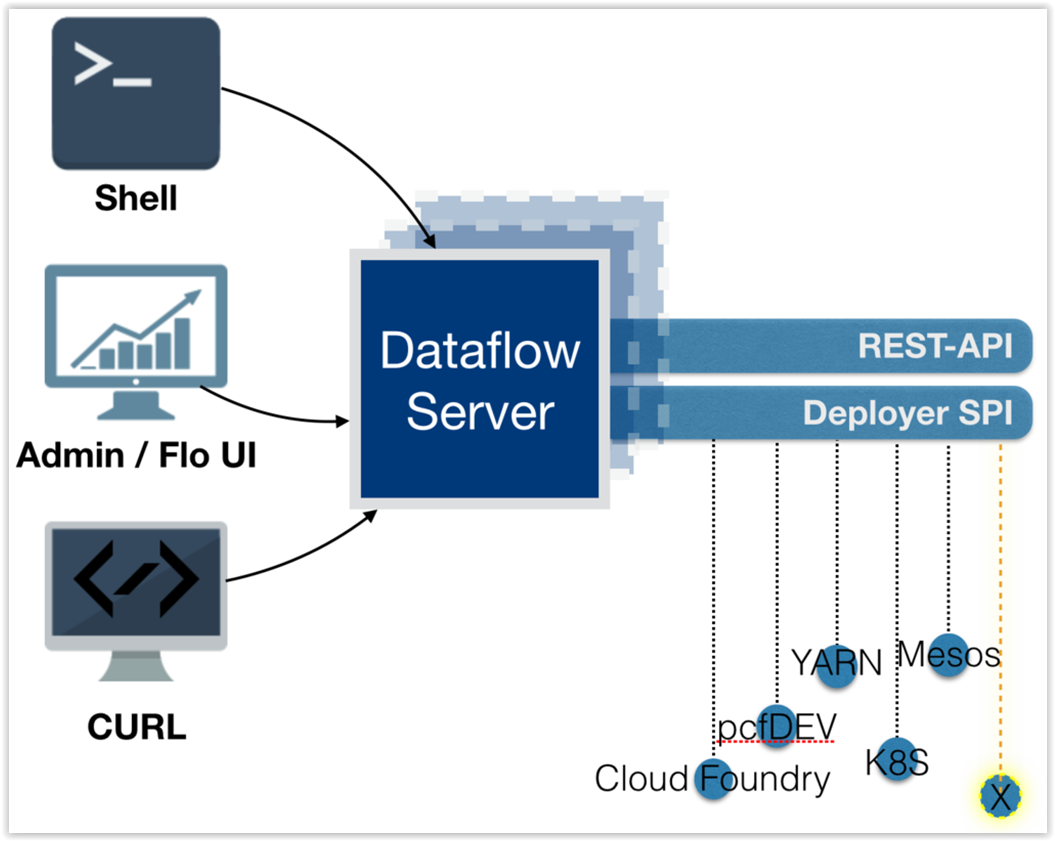
The Data Flow Server uses an embedded servlet container and exposes REST endpoints for creating, deploying, undeploying, and destroying streams and tasks, querying runtime state, analytics, and the like. The Data Flow Server is implemented using Spring’s MVC framework and the Spring HATEOAS library to create REST representations that follow the HATEOAS principle.
11.2. Customization
Each Data Flow Server executable jar targets a single runtime by delegating to the implementation of the deployer Service Provider Interface found on the classpath.
We provide a Data Flow Server executable jar that targets a single runtime. The Data Flow server delegates to the implementation of the deployer Service Provider Interface found on the classpath. In the current version, there are no endpoints specific to a target runtime, but may be available in future releases as a convenience to access runtime specific features
While we provide a server executable for each of the target runtimes you can also create your own customized server application using Spring Initialzr. This let’s you add or remove functionality relative to the executable jar we provide. For example, adding additional security implementations, custom endpoints, or removing Task or Analytics REST endpoints. You can also enable or disable some features through the use of feature toggles.
11.3. Security
The Data Flow Server executable jars support basic http, LDAP(S), File-based, and OAuth 2.0 authentication to access its endpoints. Refer to the security section for more information.
Authorization via groups is planned for a future release.
12. Runtime
12.1. Fault Tolerance
The target runtimes supported by Data Flow all have the ability to restart a long lived application should it fail. Spring Cloud Data Flow sets up whatever health probe is required by the runtime environment when deploying the application.
The collective state of all applications that comprise the stream is used to determine the state of the stream. If an application fails, the state of the stream will change from ‘deployed’ to ‘partial’.
12.2. Resource Management
Each target runtime lets you control the amount of memory, disk and CPU that is allocated to each application. These are passed as properties in the deployment manifest using key names that are unique to each runtime. Refer to the each platforms server documentation for more information.
12.3. Scaling at runtime
When deploying a stream, you can set the instance count for each individual application that comprises the stream. Once the stream is deployed, each target runtime lets you control the target number of instances for each individual application. Using the APIs, UIs, or command line tools for each runtime, you can scale up or down the number of instances as required. Future work will provide a portable command in the Data Flow Server to perform this operation.
Currently, this is not supported with the Kafka binder (based on the 0.8 simple consumer at the time of the release), as well as partitioned streams, for which the suggested workaround is redeploying the stream with an updated number of instances. Both cases require a static consumer set up based on information about the total instance count and current instance index, a limitation intended to be addressed in future releases. For example, Kafka 0.9 and higher provides good infrastructure for scaling applications dynamically and will be available as an alternative to the current Kafka 0.8 based binder in the near future. One specific concern regarding scaling partitioned streams is the handling of local state, which is typically reshuffled as the number of instances is changed. This is also intended to be addressed in the future versions, by providing first class support for local state management.
12.4. Application Versioning
Application versioning, that is upgrading or downgrading an application from one version to another, is not directly supported by Spring Cloud Data Flow. You must rely on specific target runtime features to perform these operational tasks.
The roadmap for Spring Cloud Data Flow will deploy applications that are compatible with Spinnaker to manage the complete application lifecycle. This also includes automated canary analysis backed by application metrics. Portable commands in the Data Flow server to trigger pipelines in Spinnaker are also planned.
Getting Started
13. Deploying Streams on Kubernetes
In this getting started guide, the Data Flow Server is deployed to the Kubernetes cluster. This means that we need to make available an RDBMS service for stream and task repositories, app registry plus a transport option of either Kafka or Rabbit MQ. We also need a Redis instance if we are planning on using the analytics features.
|
This guide describes setting up an environment for testing Spring Cloud Data Flow on Google Container Engine and is not meant to be a definitive guide for setting up a production environment. Feel free to adjust the suggestions to fit your test set-up. PLease remember that a production environment requires much more consideration for persistent storage of message queues, high availabillity, security etc. |
|
Currently, only apps registered with a Note that we do support Maven resources for the I.e. the below app registration is valid: but any app registered with a Maven, HTTP or File resource for the executable jar (using a |
-
Deploy a Kubernetes cluster.
The Kubernetes Getting Started guide lets you choose among many deployment options so you can pick one that you are most comfortable using. We have successfully used the Vagrant option from a downloaded Kubernetes release.
We have also used the Minikube project to run a local Kubernetes cluster for testing.
The rest of this getting started guide assumes that you have a working Kubernetes cluster and a
kubectlcommand line. For the MySQL service we used thegcloudcomand line utility. See the docs for installing both these utilities: Installing Cloud SDK and Installing and Setting up kubectl. -
Create a Kafka service on the Kubernetes cluster.
The Kafka service will be used for messaging between modules in the stream. You can instead use Rabbit MQ, but, in order to simplify, we only show the Kafka configurations in this guide. There are sample replication controller and service YAML files in the
spring-cloud-dataflow-server-kubernetesrepository that you can use as a starting point as they have the required metadata set for service discovery by the modules. For Kafka we use the files with a "zk" and "kafka" prefix.$ git clone https://github.com/spring-cloud/spring-cloud-dataflow-server-kubernetes $ cd spring-cloud-dataflow-server-kubernetes $ kubectl create -f src/etc/kubernetes/kafka-zk-controller.yml $ kubectl create -f src/etc/kubernetes/kafka-zk-service.yml $ kubectl create -f src/etc/kubernetes/kafka-controller.yml $ kubectl create -f src/etc/kubernetes/kafka-service.ymlYou can use the command
kubectl get podsto verify that the controller and service is running. Use the commandkubectl get servicesto check on the state of the service. Use the commandskubectl delete svc kafkaandkubectl delete rc kafka-brokerpluskubectl delete svc kafka-zkandkubectl delete rc kafka-zkto clean up afterwards. -
Create a MySQL service on the Kubernetes cluster.
We are using MySQL for this guide, but you could use Postgres or H2 database instead. We include JDBC drivers for all three of these databases, you would just have to adjust the database URL and driver class name settings.
Before creating the MySQL service we need to create a persistent disk and modify the password in the config file. To create a persistent disk you can use the following command:
$ gcloud compute disks create mysql-disk --size 200 --type pd-standardModify the password in the
src/etc/kubernetes/mysql-controller.ymlfile inside thespring-cloud-dataflow-server-kubernetesrepository. Then run the following commands to start the database service:$ kubectl create -f src/etc/kubernetes/mysql-controller.yml $ kubectl create -f src/etc/kubernetes/mysql-service.ymlAgain, you can use the command
kubectl get podsto verify that the controller is running. Note that it can take a minute or so until there is an external IP address for the MySQL server. Use the commandkubectl get servicesto check on the state of the service and look for when there is a value under the EXTERNAL_IP column. Use the commandskubectl delete svc mysqlandkubectl delete rc mysqlto clean up afterwards. Use the EXTERNAL_IP address to connect to the database and create atestdatabase that we can use for our testing. Use your favorit SQL developer tool for this:CREATE DATABASE test; -
Create a Redis service on the Kubernetes cluster.
The Redis service will be used for the analytics functionality. There are sample replication controller and service YAML files in the
spring-cloud-dataflow-server-kubernetesrepository that you can use as a starting point as they have the required metadata set for service discovery by the modules.$ kubectl create -f src/etc/kubernetes/redis-controller.yml $ kubectl create -f src/etc/kubernetes/redis-service.ymlIf you don’t need the analytics functionality you can turn this feature off by changing SPRING_CLOUD_DATAFLOW_FEATURES_ANALYTICS_ENABLEDto false in thescdf-controller.ymlfile. If you don’t install the Redis service then you should also remove the Redis configuration settings inscdf-config-kafka.ymlmentioned below. -
Deploy the Metrics Collector on the Kubernetes cluster.
The Metrics Collector will provide message rates for all deployed stream apps. These message rates will be visible in the Dashboard UI.
$ kubectl create -f src/etc/kubernetes/metrics-controller-kafka.yml $ kubectl create -f src/etc/kubernetes/metrics-service.yml -
Update configuration files with values needed to connect to the required services.
The Data Flow Server uses the Fabric8 Java client library to connect to the Kubernetes cluster. We are using environment variables to set the values needed when deploying the Data Flow server to Kubernetes. We are also using the Fabric8 Spring Cloud integration with Kubernetes library to access Kubernetes ConfigMap and Secrets settings. The ConfigMap settings are specified in the
src/etc/kubernetes/scdf-config.ymlfile and the Secrets in thesrc/etc/kubernetes/scdf-secrets.ymlfile. Modify the password for MySQL in the latter if you changed it. It has to be provided encoded as base64.We are now configuring the Data Flow server with file based security and the default user is 'user' with a password of 'password'. Fel free to change this in the src/etc/kubernetes/scdf-config.ymlfile.This approach supports using one Data Flow server instance per Kubernetes namespace.
-
Deploy the Spring Cloud Data Flow Server for Kubernetes using the Docker image and the configuration settings you just modified.
$ kubectl create -f src/etc/kubernetes/scdf-config-kafka.yml
$ kubectl create -f src/etc/kubernetes/scdf-secrets.yml
$ kubectl create -f src/etc/kubernetes/scdf-service.yml
$ kubectl create -f src/etc/kubernetes/scdf-controller.yml
We haven’t tuned the memory use of the OOTB apps yet, so to be on the safe side we are increasing the memory for the pods by providing the following property: spring.cloud.deployer.kubernetes.memory=640MiUse the
kubectl get svccommand to locate the EXTERNAL_IP address assigned toscdf, we use that to connect from the shell.$ kubectl get svc NAME CLUSTER-IP EXTERNAL-IP PORT(S) AGE kafka 10.103.248.211 <none> 9092/TCP 14d kubernetes 10.103.240.1 <none> 443/TCP 16d mysql 10.103.251.179 104.154.246.220 3306/TCP 10d metrics 10.103.248.127 <none> 80/TCP 8d redis 10.103.242.191 <none> 6379/TCP 8d scdf 10.103.246.82 130.211.203.246 80/TCP 4m zk 10.103.243.29 <none> 2181/TCP 14d -
Download and run the Spring Cloud Data Flow shell.
wget http://repo.spring.io/release/org/springframework/cloud/spring-cloud-dataflow-shell/1.2.0.RELEASE/spring-cloud-dataflow-shell-1.2.0.RELEASE.jar

$ java -jar spring-cloud-dataflow-shell-1.2.0.RELEASE.jar
That should give you the following startup message from the shell:
  ____                              ____ _                __
 / ___| _ __  _ __(_)_ __   __ _   / ___| | ___  _   _  __| |
 \___ \| '_ \| '__| | '_ \ / _` | | |   | |/ _ \| | | |/ _` |
  ___) | |_) | |  | | | | | (_| | | |___| | (_) | |_| | (_| |
 |____/| .__/|_|  |_|_| |_|\__, |  \____|_|\___/ \__,_|\__,_|
  ____ |_|    _          __|___/                 __________
 |  _ \  __ _| |_ __ _  |  ___| | _____      __  \ \ \ \ \ \
 | | | |/ _` | __/ _` | | |_  | |/ _ \ \ /\ / /   \ \ \ \ \ \
 | |_| | (_| | || (_| | |  _| | | (_) \ V  V /    / / / / / /
 |____/ \__,_|\__\__,_| |_|   |_|\___/ \_/\_/    /_/_/_/_/_/

1.2.0.RELEASE

Welcome to the Spring Cloud Data Flow shell. For assistance hit TAB or type "help".
server-unknown:>
Configure the Data Flow server URI with the following command (use the IP address from previous step) using the default user and password settings:
server-unknown:>dataflow config server --username user --password password --uri http://130.211.203.246/ Successfully targeted http://130.211.203.246/ dataflow:> -
Register the Kafka version of the
timeandlogapps using the shell and also register thetimestampapp.dataflow:>app register --type source --name time --uri docker:springcloudstream/time-source-kafka:latest dataflow:>app register --type sink --name log --uri docker:springcloudstream/log-sink-kafka:latest dataflow:>app register --type task --name timestamp --uri docker:springcloudtask/timestamp-task:latest -
Alternatively, if you would like to register all out-of-the-box stream applications built with the Kafka binder in bulk, you can with the following command. For more details, review how to register applications.
dataflow:>app import --uri http://bit.ly/stream-applications-kafka-docker -
Deploy a simple stream in the shell
dataflow:>stream create --name ticktock --definition "time | log" --deployYou can use the command
kubectl get podsto check on the state of the pods corresponding to this stream. We can run this from the shell by running it as an OS command by adding a "!" before the command.dataflow:>! kubectl get pods command is:kubectl get pods NAME READY STATUS RESTARTS AGE kafka-d207a 1/1 Running 0 50m ticktock-log-qnk72 1/1 Running 0 2m ticktock-time-r65cn 1/1 Running 0 2mLook at the logs for the pod deployed for the log sink.
$ kubectl logs -f ticktock-log-qnk72
...
2015-12-28 18:50:02.897  INFO 1 --- [           main] o.s.c.s.module.log.LogSinkApplication    : Started LogSinkApplication in 10.973 seconds (JVM running for 50.055)
2015-12-28 18:50:08.561  INFO 1 --- [hannel-adapter1] log.sink                                 : 2015-12-28 18:50:08
2015-12-28 18:50:09.556  INFO 1 --- [hannel-adapter1] log.sink                                 : 2015-12-28 18:50:09
2015-12-28 18:50:10.557  INFO 1 --- [hannel-adapter1] log.sink                                 : 2015-12-28 18:50:10
2015-12-28 18:50:11.558  INFO 1 --- [hannel-adapter1] log.sink                                 : 2015-12-28 18:50:11
If you need to specify any of the app specific configuration properties then you must use "long-form" of them including the app specific prefix like --jdbc.tableName=TEST_DATA. This is due to the server not being able to access the metadata for the Docker based starter apps. You will also not see the configuration properties listed when using theapp infocommand or in the Dashboard GUI.If you need to be able to connect from outside of the Kubernetes cluster to an app that you deploy, like the http-source, then you can provide a deployment property ofdeployer.http.kubernetes.createLoadBalancer=truefor the app to specify that you want to have a LoadBalancer with an external IP address created for your app’s service.To register the
http-sourceand use it in a stream where you can post data to it, you can use the following commands:dataflow:>app register --type source --name http --uri docker:springcloudstream/http-source-kafka:latest dataflow:>stream create --name test --definition "http | log" dataflow:>stream deploy test --properties "deployer.http.kubernetes.createLoadBalancer=true"Now, look up the external IP address for the
httpapp (it can sometimes take a minute or two for the external IP to get assigned):dataflow:>! kubectl get service command is:kubectl get service NAME CLUSTER-IP EXTERNAL-IP PORT(S) AGE kafka 10.103.240.92 <none> 9092/TCP 7m kubernetes 10.103.240.1 <none> 443/TCP 4h test-http 10.103.251.157 130.211.200.96 8080/TCP 58s test-log 10.103.240.28 <none> 8080/TCP 59s zk 10.103.247.25 <none> 2181/TCP 7mNext, post some data to the
test-httpapp:dataflow:>http post --target http://130.211.200.96:8080 --data "Hello"Finally, look at the logs for the
test-logpod:dataflow:>! kubectl get pods command is:kubectl get pods NAME READY STATUS RESTARTS AGE kafka-o20qq 1/1 Running 0 9m mysql-o2v83 1/1 Running 0 9m redis-zb87a 1/1 Running 0 8m test-http-9obkq 1/1 Running 0 2m test-log-ysiz3 1/1 Running 0 2m dataflow:>! kubectl logs test-log-ysiz3 command is:kubectl logs test-log-ysiz3 ... 2016-04-27 16:54:29.789 INFO 1 --- [ main] o.s.c.s.b.k.KafkaMessageChannelBinder$3 : started inbound.test.http.test 2016-04-27 16:54:29.799 INFO 1 --- [ main] o.s.c.support.DefaultLifecycleProcessor : Starting beans in phase 0 2016-04-27 16:54:29.799 INFO 1 --- [ main] o.s.c.support.DefaultLifecycleProcessor : Starting beans in phase 2147482647 2016-04-27 16:54:29.895 INFO 1 --- [ main] s.b.c.e.t.TomcatEmbeddedServletContainer : Tomcat started on port(s): 8080 (http) 2016-04-27 16:54:29.896 INFO 1 --- [ kafka-binder-] log.sink : HelloA useful command to help in troubleshooting issues, such as a container that has a fatal error starting up, add the options
--previousto view last terminated container log. You can also get more detailed information about the pods by using thekubctl describelike:kubectl describe pods/ticktock-log-qnk72 -
Destroy the stream
dataflow:>stream destroy --name ticktock -
Create a task and launch it
Let’s create a simple task definition and launch it.
dataflow:>task create task1 --definition "timestamp"
dataflow:>task launch task1
We can now list the tasks and executions using these commands:
dataflow:>task list ╔═════════╤═══════════════╤═══════════╗ ║Task Name│Task Definition│Task Status║ ╠═════════╪═══════════════╪═══════════╣ ║task1 │timestamp │running ║ ╚═════════╧═══════════════╧═══════════╝ dataflow:>task execution list ╔═════════╤══╤════════════════════════════╤════════════════════════════╤═════════╗ ║Task Name│ID│ Start Time │ End Time │Exit Code║ ╠═════════╪══╪════════════════════════════╪════════════════════════════╪═════════╣ ║task1 │1 │Fri May 05 18:12:05 EDT 2017│Fri May 05 18:12:05 EDT 2017│0 ║ ╚═════════╧══╧════════════════════════════╧════════════════════════════╧═════════╝ -
Destroy the task
dataflow:>task destroy --name task1
Server Configuration
In this section you will learn how to configure Spring Cloud Data Flow server’s features such as the relational database to use and security.
14. Feature Toggles
Data Flow server offers specific set of features that can be enabled/disabled when launching. These features include all the lifecycle operations, REST endpoints (server, client implementations including Shell and the UI) for:
-
Streams
-
Tasks
-
Analytics
You can enable or disable these features by setting the following boolean environment variables when launching the Data Flow server:
-
SPRING_CLOUD_DATAFLOW_FEATURES_STREAMS_ENABLED -
SPRING_CLOUD_DATAFLOW_FEATURES_TASKS_ENABLED -
SPRING_CLOUD_DATAFLOW_FEATURES_ANALYTICS_ENABLED
By default, all the features are enabled.
Since analytics feature is enabled by default, the Data Flow server is expected to have a valid Redis store available as analytic repository as we provide a default implementation of analytics based on Redis. This also means that the Data Flow server’s health depends on the redis store availability as well. If you do not want to enabled HTTP endpoints to read analytics data written to Redis, then disable the analytics feature using the property mentioned above.
|
The REST endpoint /features provides information on the features enabled/disabled.
15. General Configuration
Configuration properties can be passed to the Data Flow Server using Kubernetes ConfigMap and Secrets. The server uses the Fabric8 spring-cloud-kubernetes module to process both ConfigMap and Secrets settings. You just need to enable the ConfigMap support by passing in an environment variable of SPRING_CLOUD_KUBERNETES_CONFIG_NAME and setting that to the name of the ConfigMap. Same is true for the Secrets where the environment variable is SPRING_CLOUD_KUBERNETES_SECRETS_NAME. To use the Secrets you also need to set SPRING_CLOUD_KUBERNETES_SECRETS_ENABLE_API to true.
An example configuration could look like the following where we configure Kafka, MySQL and Redis for the server:
apiVersion: v1
kind: ConfigMap
metadata:
  name: scdf-config
data:
  application.yaml: |-
    spring:
      cloud:
        deployer:
          kubernetes:
            environmentVariables: 'SPRING_CLOUD_STREAM_KAFKA_BINDER_BROKERS=${KAFKA_SERVICE_HOST}:${KAFKA_SERVICE_PORT},SPRING_CLOUD_STREAM_KAFKA_BINDER_ZK_NODES=${KAFKA_ZK_SERVICE_HOST}:${KAFKA_ZK_SERVICE_PORT},SPRING_REDIS_HOST=${REDIS_SERVICE_HOST},SPRING_REDIS_PORT=${REDIS_SERVICE_PORT}'
      datasource:
        url: jdbc:mysql://${MYSQL_SERVICE_HOST}:${MYSQL_SERVICE_PORT}/test
        driverClassName: org.mariadb.jdbc.Driver
        testOnBorrow: true
        validationQuery: "SELECT 1"
      redis:
        host: ${REDIS_SERVICE_HOST}
        port: ${REDIS_SERVICE_PORT}
We assume here that Kafka is deployed using kafka and kafka_zk as the service names. For the MySQL we assume the service name is mysql and for Redis we assume it is redis. Kubernetes will publish these services host and port values as environment variables that we can use when configuring any deployed apps.
We prefer to provide the MySQL connection secrets in a Secrets file:
apiVersion: v1
kind: Secret
metadata:
  name: scdf-secrets
data:
  spring.datasource.username: cm9vdA==
  spring.datasource.password: eW91cnBhc3N3b3Jk
The username and password are provided as base64 encoded values.
16. Database Configuration
Spring Cloud Data Flow provides schemas for H2, HSQLDB, MySQL, Oracle, Postgresql, DB2 and SqlServer that will be automatically created when the server starts.
The JDBC drivers for MySQL (via MariaDB driver), HSQLDB, PostgreSQL along with embedded H2 are available out of the box. If you are using any other database, then the corresponding JDBC driver jar needs to be on the classpath of the server.
For instance, If you are using MySQL in addition to username and password in the Secrets file provide the following properties in the ConfigMap:
data:
  application.yaml: |-
    spring:
      datasource:
        url: jdbc:mysql://${MYSQL_SERVICE_HOST}:${MYSQL_SERVICE_PORT}/test
        driverClassName: org.mariadb.jdbc.Driver
For PostgreSQL:
data:
  application.yaml: |-
    spring:
      datasource:
        url: jdbc:postgresql://${PGSQL_SERVICE_HOST}:${PGSQL_SERVICE_PORT}/database
        driverClassName: org.postgresql.Driver
For HSQLDB:
data:
  application.yaml: |-
    spring:
      datasource:
        url: jdbc:hsqldb:hsql://${HSQLDB_SERVICE_HOST}:${HSQLDB_SERVICE_PORT}/database
        driverClassName: org.hsqldb.jdbc.JDBCDriver
There is a schema update to the Spring Cloud Data Flow datastore when
upgrading from version 1.0.x to 1.1.x. Migration scripts for specific
database types can be found
here.
|
17. Security
We are now securing the server application in the sample configurations file used in the Getting Started section.
This section covers the basic configuration settings we provide in the provided sample configuration, please refer to the core security documentation for more detailed coverage of the security configuration options for the Spring Cloud Data Flow server and shell.
The security settings in the scdf-config-kafka.yml file are:
    security:
      basic:
        enabled: true                                         (1)
        realm: Spring Cloud Data Flow                         (2)
    spring:
      cloud:
        dataflow:
          security:
            authentication:
              file:
                enabled: true
                users:
                  admin: admin, ROLE_MANAGE, ROLE_VIEW        (3)
user: password, ROLE_VIEW, ROLE_CREATE (4)| 1 | Enable security |
| 2 | Optionally set the realm, defaults to "Spring" |
| 3 | Create an 'admin' user with passowrd set to 'admin' that can view apps, streams and tasks and that can also view management endpoints |
| 4 | Create a 'user' user with passsword set to 'password' than can register apps and create streams and tasks and also view them |
Feel free to change user names and passwords to suite, and also maybe move the definition of users to a Kubernetes Secret.
18. Monitoring and Management
We recommend using the kubectl command for troubleshooting streams and tasks.
You can list all artifacts used by using the following command:
kubectl get cm,secrets,svc,rc,pod18.1. Server
You can access the server log by using the following command (just supply the name of pod for the server):
kubectl logs <scdf-pod-name>18.2. Streams
The streams apps are deployed with teh stream name followed by the name of the app and for processors and sinks there is also an instance index appended.
To see details for a specifc app deployment you can use (just supply the name of pod for the app):
kubectl details <app-pod-name>For the application logs use:
kubectl logs <app-pod-name>If you would like to tail a log you can use:
kubectl logs -f <app-pod-name>18.3. Tasks
Tasks are launched as bare pods without a replication controller. The pods remain after the tasks complete and this gives you an opportunity to review the logs.
To review the task logs use:
kubectl logs <task-pod-name>You have two options to delete completed pods. You can delete them manually once they are no longer needed.
To delete the task pod use:
kubectl delete pod <task-pod-name>You can also use the Data Flow shell command task execution cleanup command to remove the completed pod for a task execution.
First we need to determine the ID for the task execution:
dataflow:>task execution list
╔═════════╤══╤════════════════════════════╤════════════════════════════╤═════════╗
║Task Name│ID│         Start Time         │          End Time          │Exit Code║
╠═════════╪══╪════════════════════════════╪════════════════════════════╪═════════╣
║task1    │1 │Fri May 05 18:12:05 EDT 2017│Fri May 05 18:12:05 EDT 2017│0        ║
╚═════════╧══╧════════════════════════════╧════════════════════════════╧═════════╝
Next we issue the command to cleanup the execution artifacts (the completed pod):
dataflow:>task execution cleanup --id 1
Request to clean up resources for task execution 1 has been submitted
Dashboard
This section describe how to use the Dashboard of Spring Cloud Data Flow.
19. Introduction
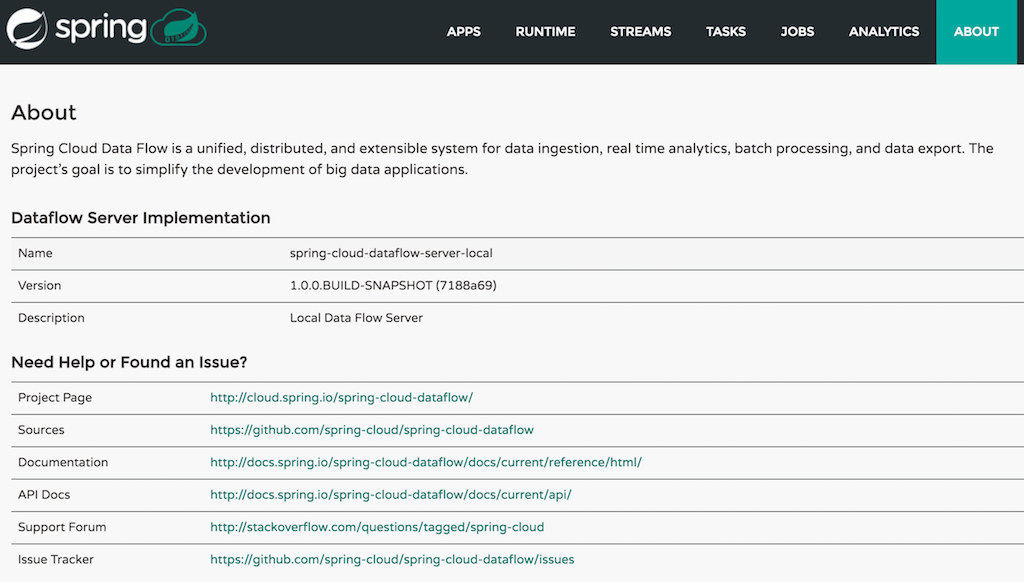
Spring Cloud Data Flow provides a browser-based GUI and it currently includes 6 tabs:
-
Apps Lists all available applications and provides the control to register/unregister them
-
Runtime Provides the Data Flow cluster view with the list of all running applications
-
Streams List, create, deploy, and destroy Stream Definitions
-
Tasks List, create, launch and destroy Task Definitions
-
Jobs Perform Batch Job related functions
-
Analytics Create data visualizations for the various analytics applications
Upon starting Spring Cloud Data Flow, the Dashboard is available at:
http://<host>:<port>/dashboard
For example: http://localhost:9393/dashboard
If you have enabled https, then it will be located at https://localhost:9393/dashboard.
If you have enabled security, a login form is available at http://localhost:9393/dashboard/#/login.
The default Dashboard server port is 9393
|
20. Apps
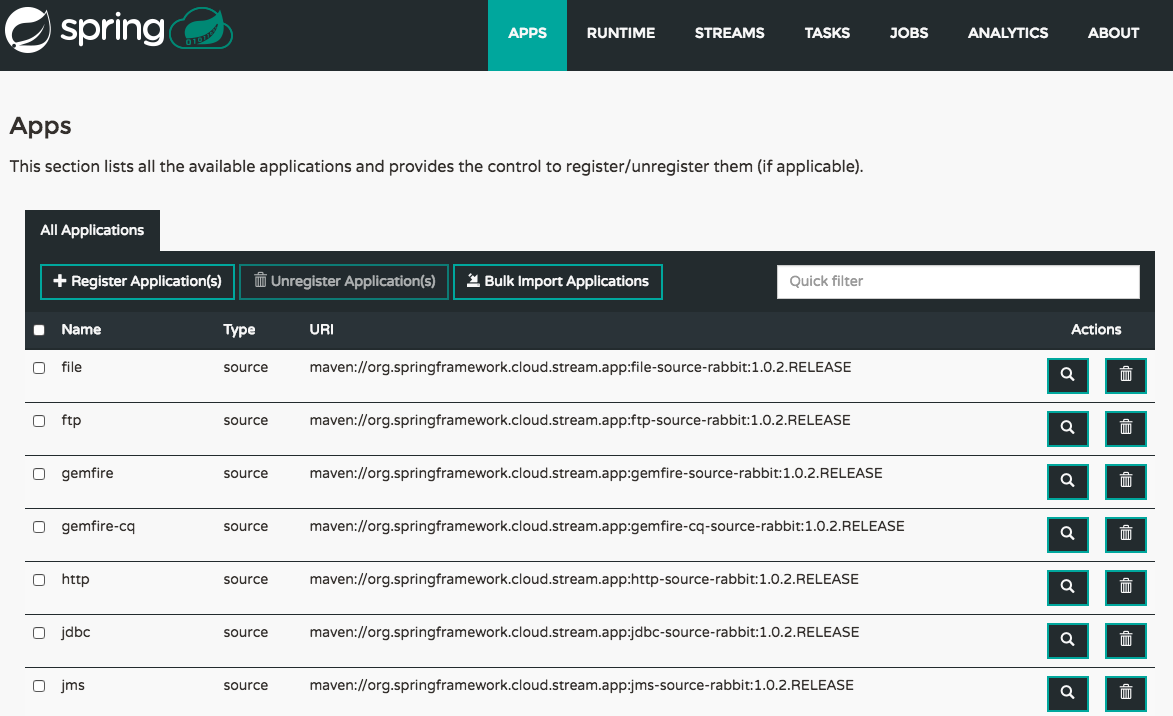
The Apps section of the Dashboard lists all the available applications and provides the control to register/unregister them (if applicable). It is possible to import a number of applications at once using the Bulk Import Applications action.
20.1. Bulk Import of Applications
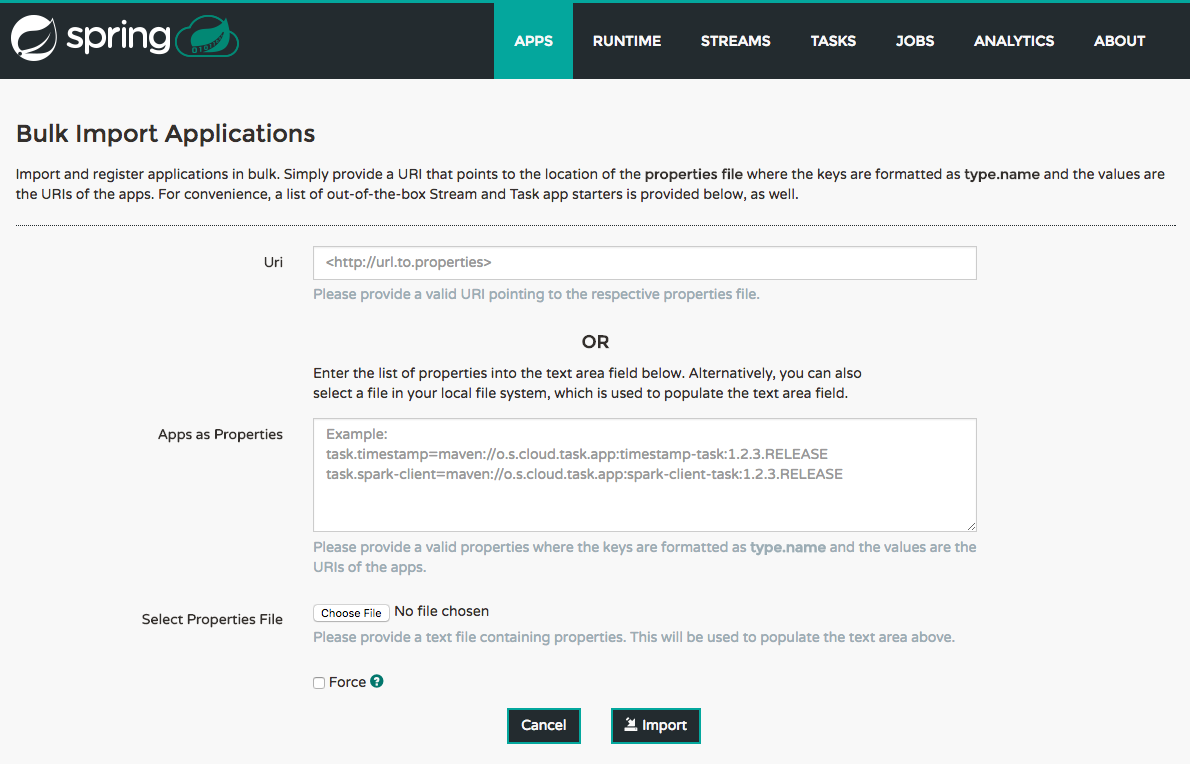
The bulk import applications page provides numerous options for defining and importing a set of applications in one go. For bulk import the application definitions are expected to be expressed in a properties style:
<type>.<name> = <coordinates>
For example:
task.timestamp=maven://org.springframework.cloud.task.app:timestamp-task:1.2.0.RELEASE
processor.transform=maven://org.springframework.cloud.stream.app:transform-processor-rabbit:1.2.0.RELEASE
At the top of the bulk import page an Uri can be specified that points to a properties file stored elsewhere, it should contain properties formatted as above. Alternatively, using the textbox labeled Apps as Properties it is possible to directly list each property string. Finally, if the properties are stored in a local file the Select Properties File option will open a local file browser to select the file. After setting your definitions via one of these routes, click Import.
At the bottom of the page there are quick links to the property files for common groups of stream apps and task apps. If those meet your needs, simply select your appropriate variant (rabbit, kafka, docker, etc) and click the Import action on those lines to immediately import all those applications.
21. Runtime
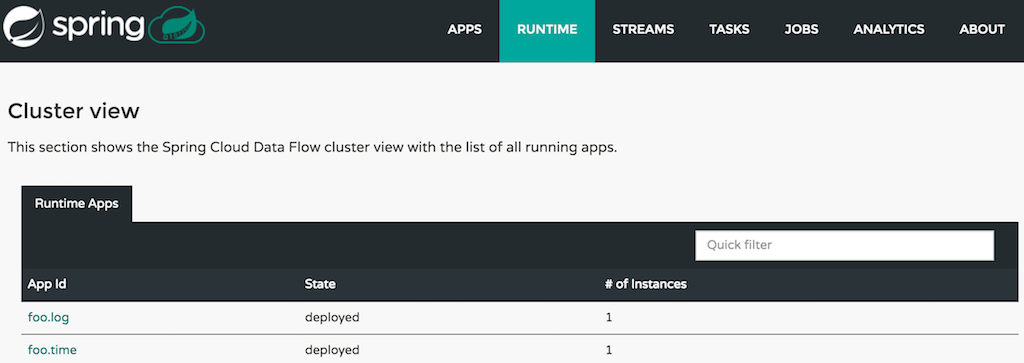
The Runtime section of the Dashboard application shows the Spring Cloud Data Flow cluster view with the list of all running applications. For each runtime app the state of the deployment and the number of deployed instances is shown. A list of the used deployment properties is available by clicking on the app id.
22. Streams
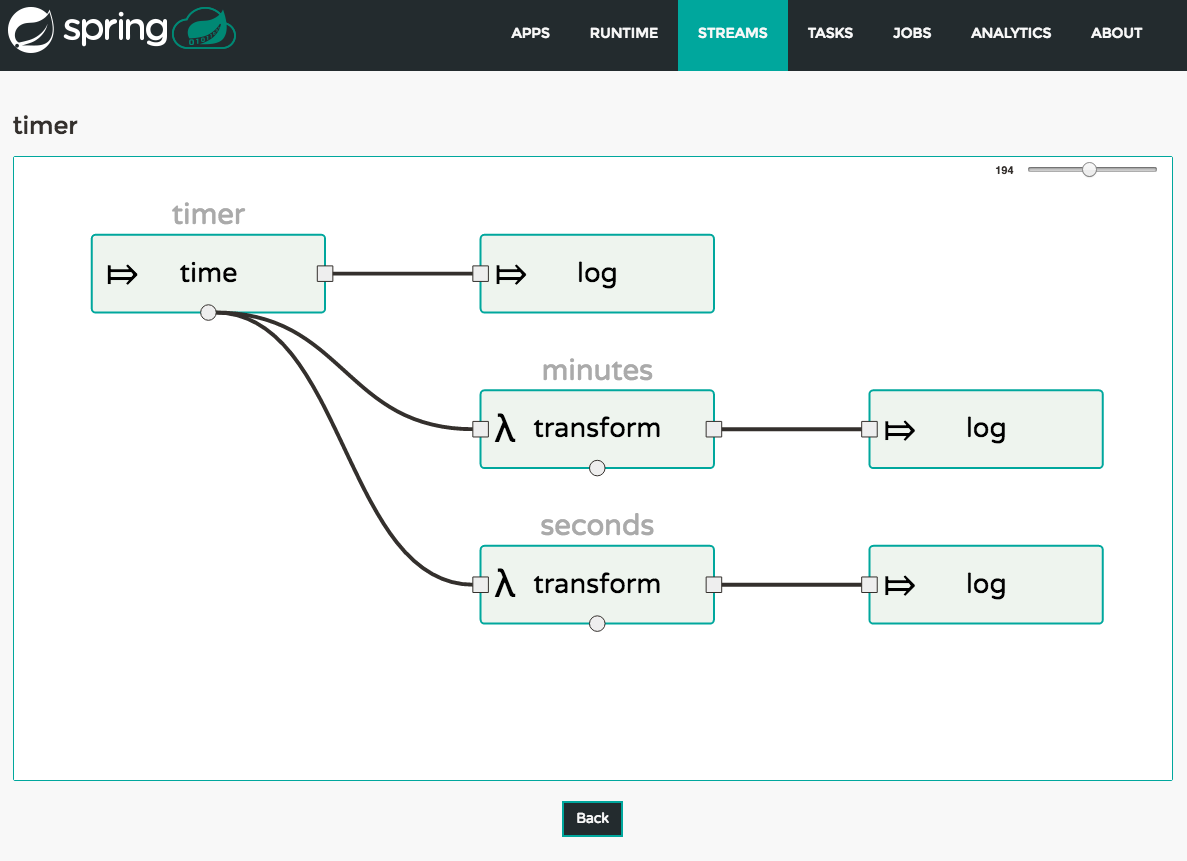
The Streams section of the Dashboard provides the Definitions tab that provides a listing of Stream definitions. There you have the option to deploy or undeploy those stream definitions. Additionally you can remove the definition by clicking on destroy. Each row includes an arrow on the left, which can be clicked to see a visual representation of the definition. Hovering over the boxes in the visual representation will show more details about the apps including any options passed to them. In this screenshot the timer stream has been expanded to show the visual representation:
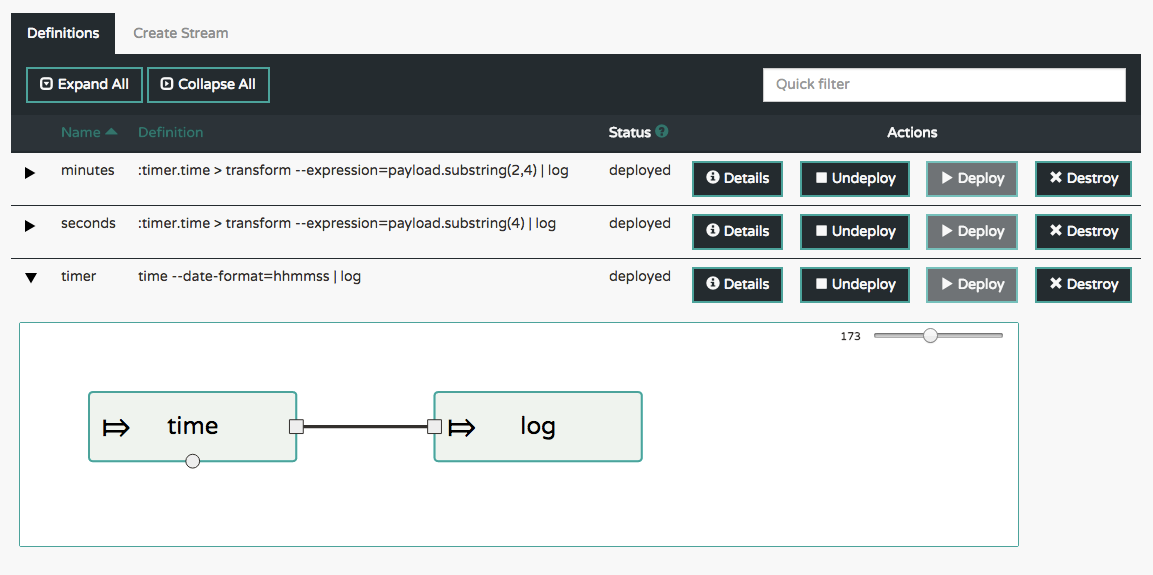
If the details button is clicked the view will change to show a visual representation of that stream and also any related streams. In the above example, if clicking details for the timer stream, the view will change to the one shown below which clearly shows the relationship between the three streams (two of them are tapping into the timer stream).
23. Create Stream
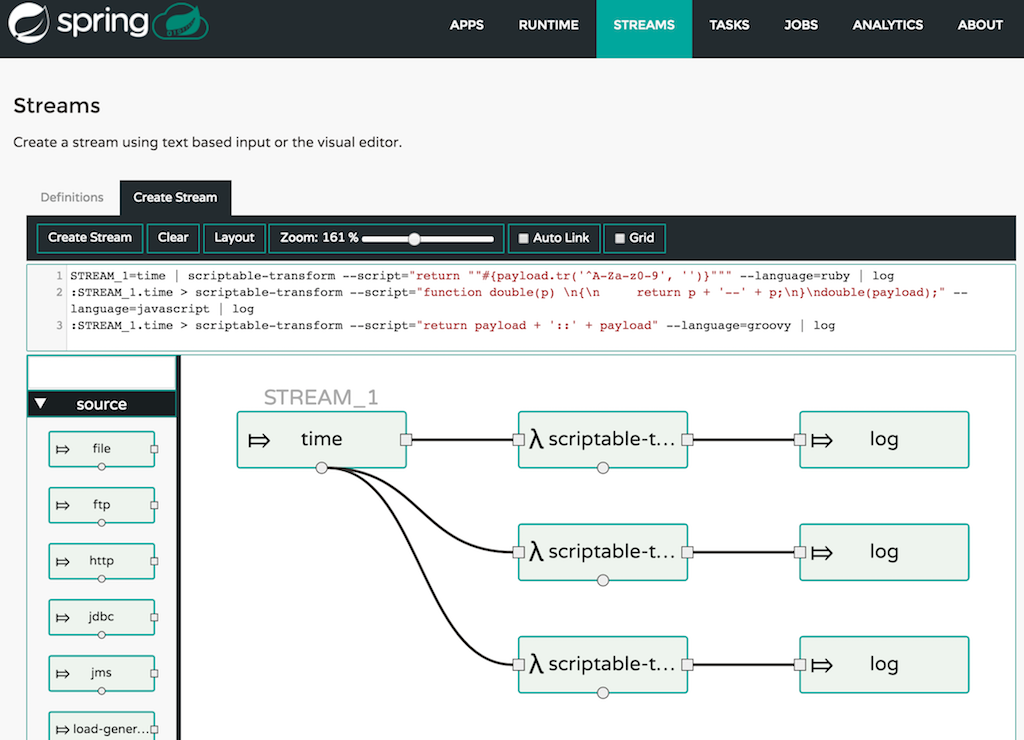
The Create Stream section of the Dashboard includes the Spring Flo designer tab that provides the canvas application, offering a interactive graphical interface for creating data pipelines.
In this tab, you can:
-
Create, manage, and visualize stream pipelines using DSL, a graphical canvas, or both
-
Write pipelines via DSL with content-assist and auto-complete
-
Use auto-adjustment and grid-layout capabilities in the GUI for simpler and interactive organization of pipelines
Watch this screencast that highlights some of the "Flo for Spring Cloud Data Flow" capabilities. Spring Flo wiki includes more detailed content on core Flo capabilities.
24. Tasks
The Tasks section of the Dashboard currently has three tabs:
-
Apps
-
Definitions
-
Executions
24.1. Apps
Apps encapsulate a unit of work into a reusable component. Within the Data Flow runtime environment Apps allow users to create definitions for Streams as well as Tasks. Consequently, the Apps tab within the Tasks section allows users to create Task definitions.
| You will also use this tab to create Batch Jobs. |
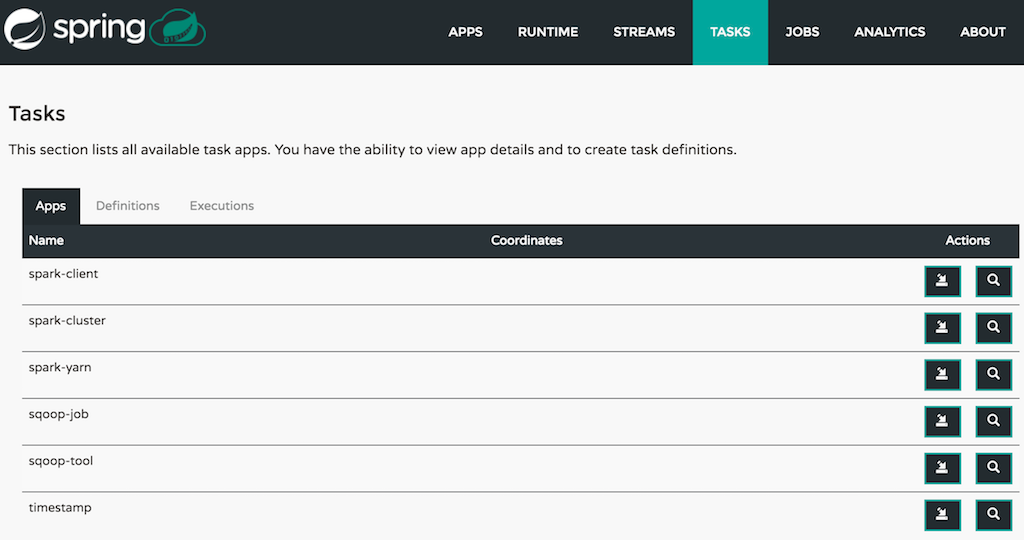
On this screen you can perform the following actions:
-
View details such as the task app options.
-
Create a Task Definition from the respective App.
24.1.1. Create a Task Definition from a selected Task App
On this screen you can create a new Task Definition. As a minimum you must provide a name for the new definition. You will also have the option to specify various properties that are used during the deployment of the app.
| Each parameter is only included if the Include checkbox is selected. |
24.1.2. View Task App Details
On this page you can view the details of a selected task app, including the list of available options (properties) for that app.
24.2. Definitions
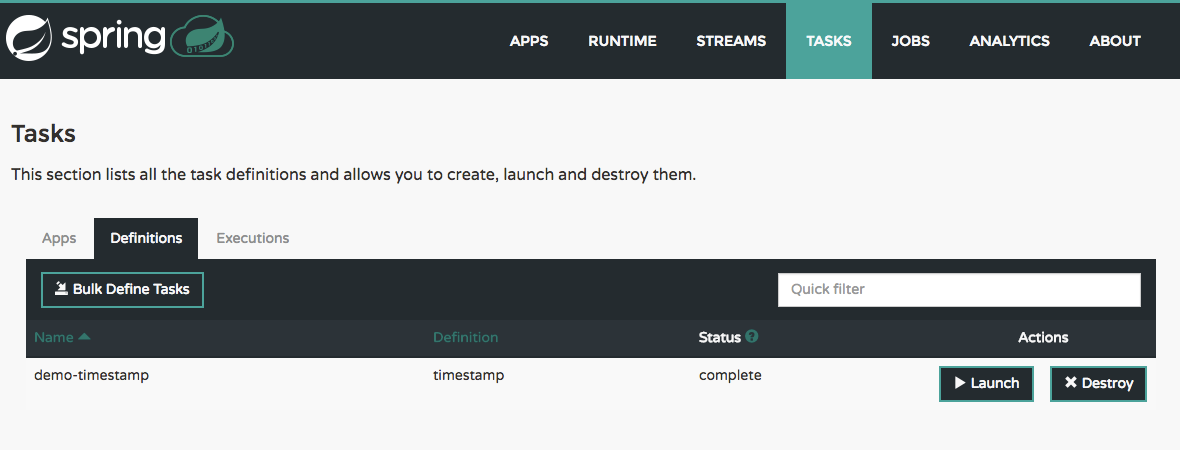
This page lists the Data Flow Task definitions and provides actions to launch or destroy those tasks. It also provides a shortcut operation to define one or more tasks using simple textual input, indicated by the bulk define tasks button.
24.2.1. Creating Task Definitions using the bulk define interface
After pressing bulk define tasks, the following screen will be shown.
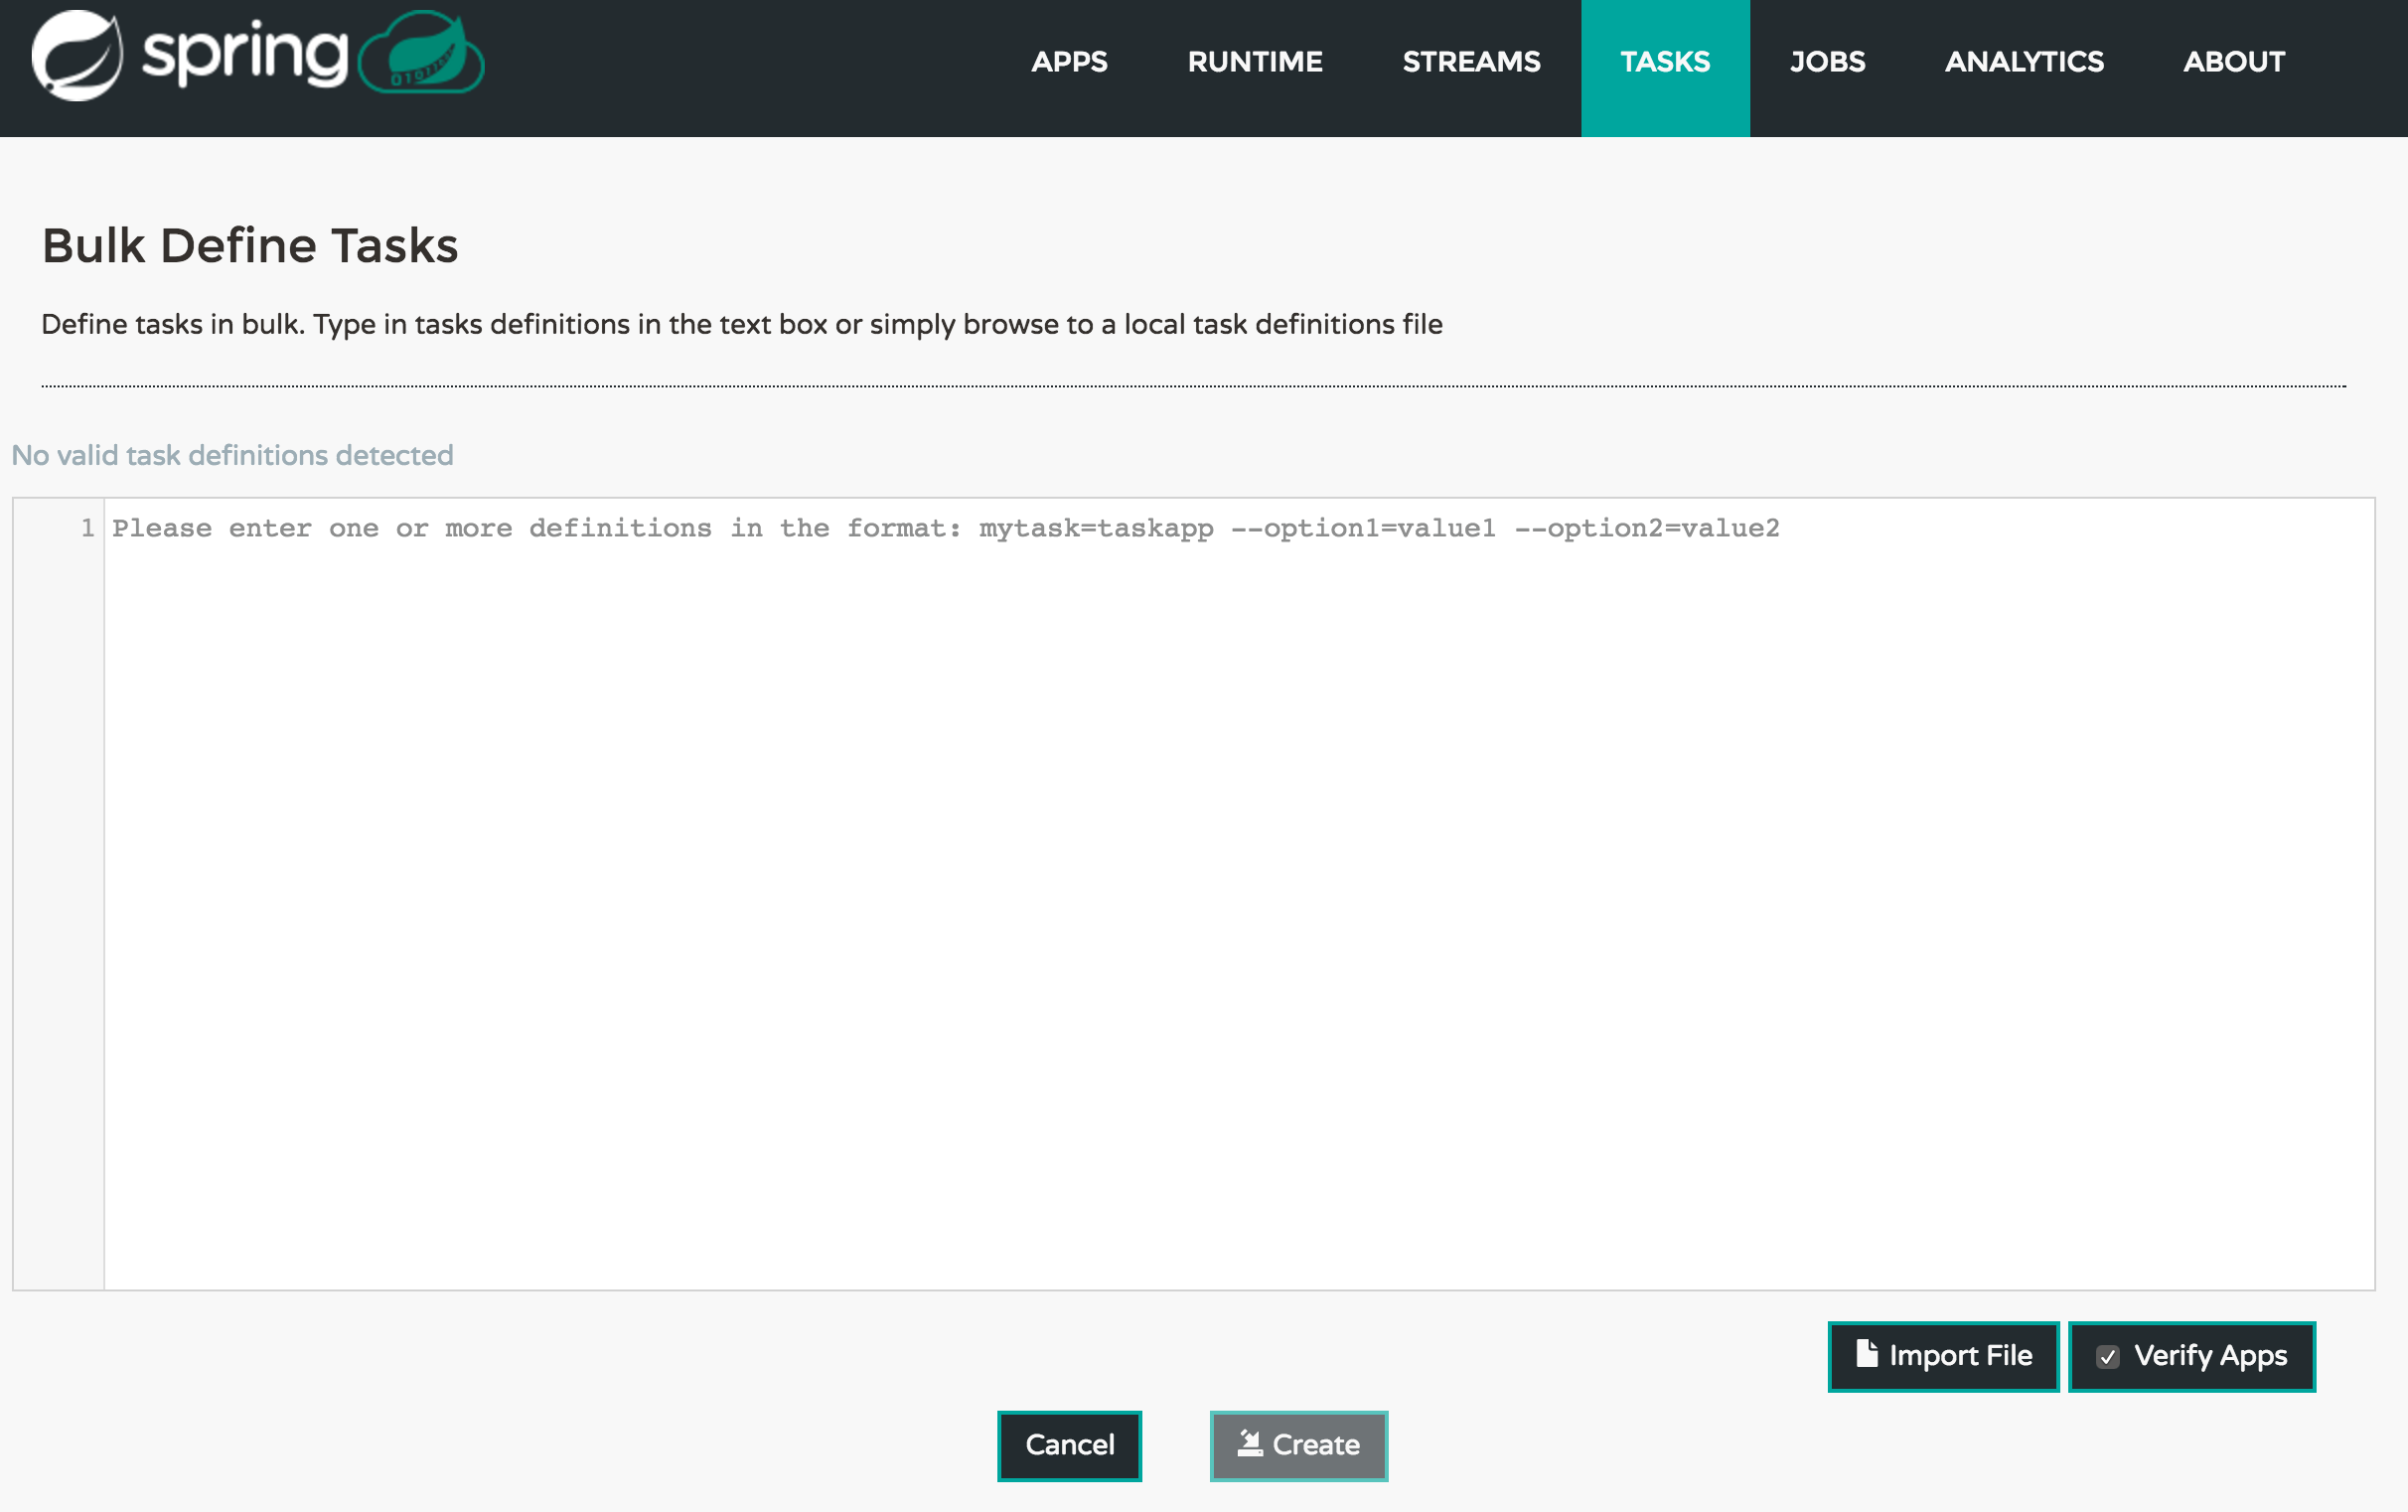
It includes a textbox where one or more definitions can be entered and then various actions performed on those definitions. The required input text format for task definitions is very basic, each line should be of the form:
<task-definition-name> = <task-application> <options>
For example:
demo-timestamp = timestamp --format=hhmmss
After entering any data a validator will run asynchronously to verify both the syntax and that the application name entered is a valid application and it supports the options specified. If validation fails the editor will show the errors with more information via tooltips.
To make it easier to enter definitions into the text area, content assist is supported. Pressing Ctrl+Space will invoke content assist to suggest simple task names (based on the line on which it is invoked), task applications and task application options. Press ESCape to close the content assist window without taking a selection.
If the validator should not verify the applications or the options (for example if specifying non-whitelisted options to the applications) then turn off that part of validation by toggling the checkbox off on the Verify Apps button - the validator will then only perform syntax checking. When correctly validated, the create button will be clickable and on pressing it the UI will proceed to create each task definition. If there are any errors during creation then after creation finishes the editor will show any lines of input, as it cannot be used in task definitions. These can then be fixed up and creation repeated. There is an import file button to open a file browser on the local file system if the definitions are in a file and it is easier to import than copy/paste.
| Bulk loading of composed task definitions is not currently supported. |
24.2.2. Creating Composed Task Definitions
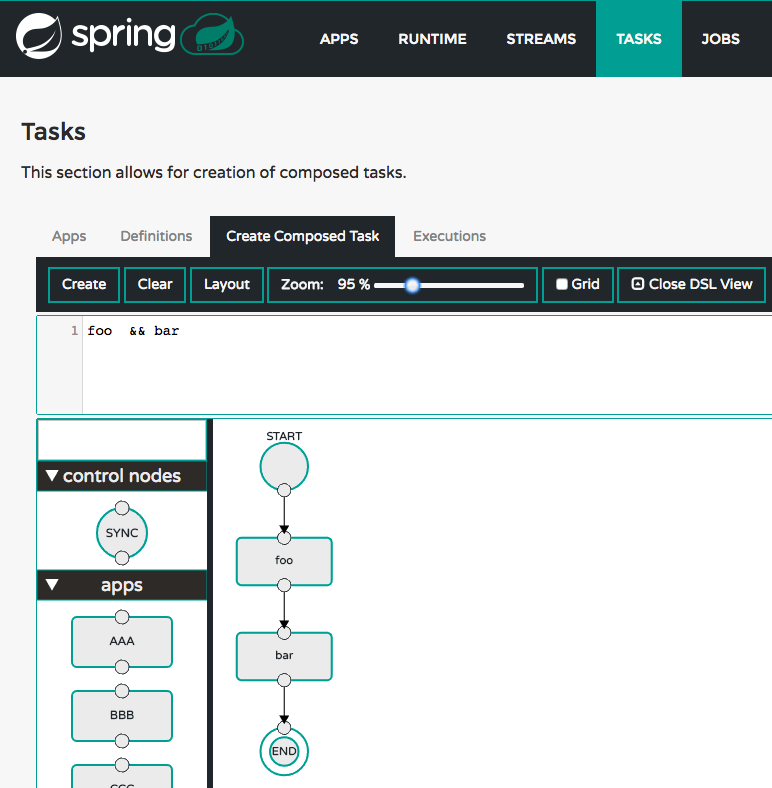
The dashboard includes the Create Composed Task tab that provides the canvas application, offering a interactive graphical interface for creating composed tasks.
In this tab, you can:
-
Create and visualize composed tasks using DSL, a graphical canvas, or both
-
Use auto-adjustment and grid-layout capabilities in the GUI for simpler and interactive organization of the composed task
24.2.3. Launching Tasks
Once the task definition is created, they can be launched through the Dashboard
as well. Navigate to the Definitions tab. Select the Task you want to launch by
pressing Launch.
On the following screen, you can define one or more Task parameters by entering:
-
Parameter Key
-
Parameter Value
Task parameters are not typed.
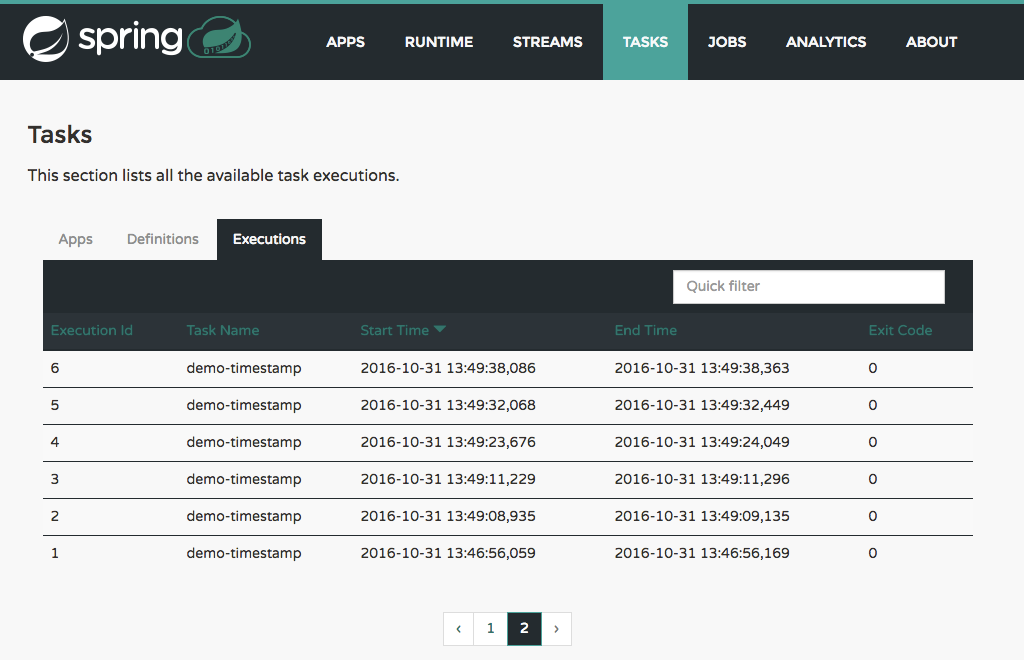
24.3. Executions
25. Jobs
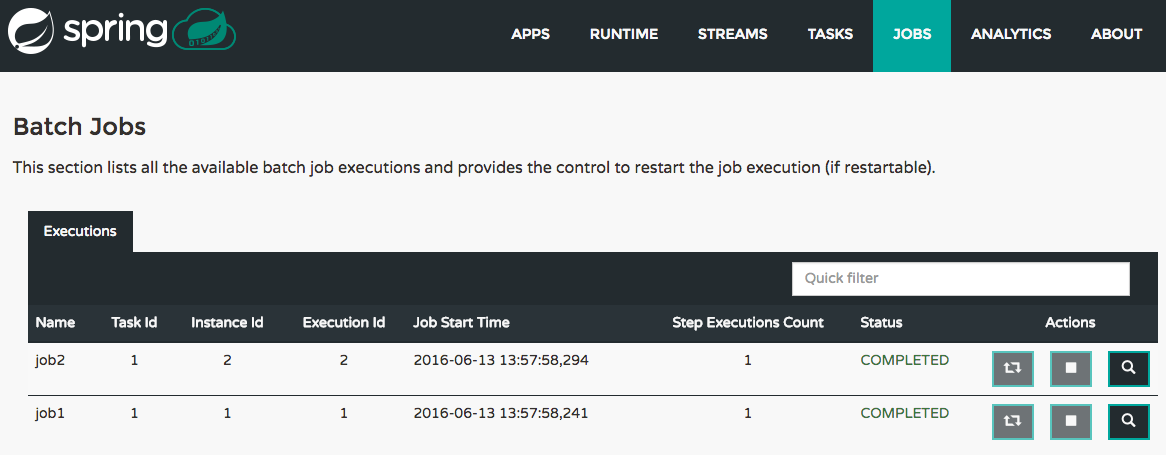
The Jobs section of the Dashboard allows you to inspect Batch Jobs. The main section of the screen provides a list of Job Executions. Batch Jobs are Tasks that were executing one or more Batch Job. As such each Job Execution has a back reference to the Task Execution Id (Task Id).
In case of a failed job, you can also restart the task. When dealing with long-running Batch Jobs, you can also request to stop it.
25.1. List job executions
This page lists the Batch Job Executions and provides the option to restart or stop a specific job execution, provided the operation is available. Furthermore, you have the option to view the Job execution details.
The list of Job Executions also shows the state of the underlying Job Definition. Thus, if the underlying definition has been deleted, deleted will be shown.
25.1.1. Job execution details
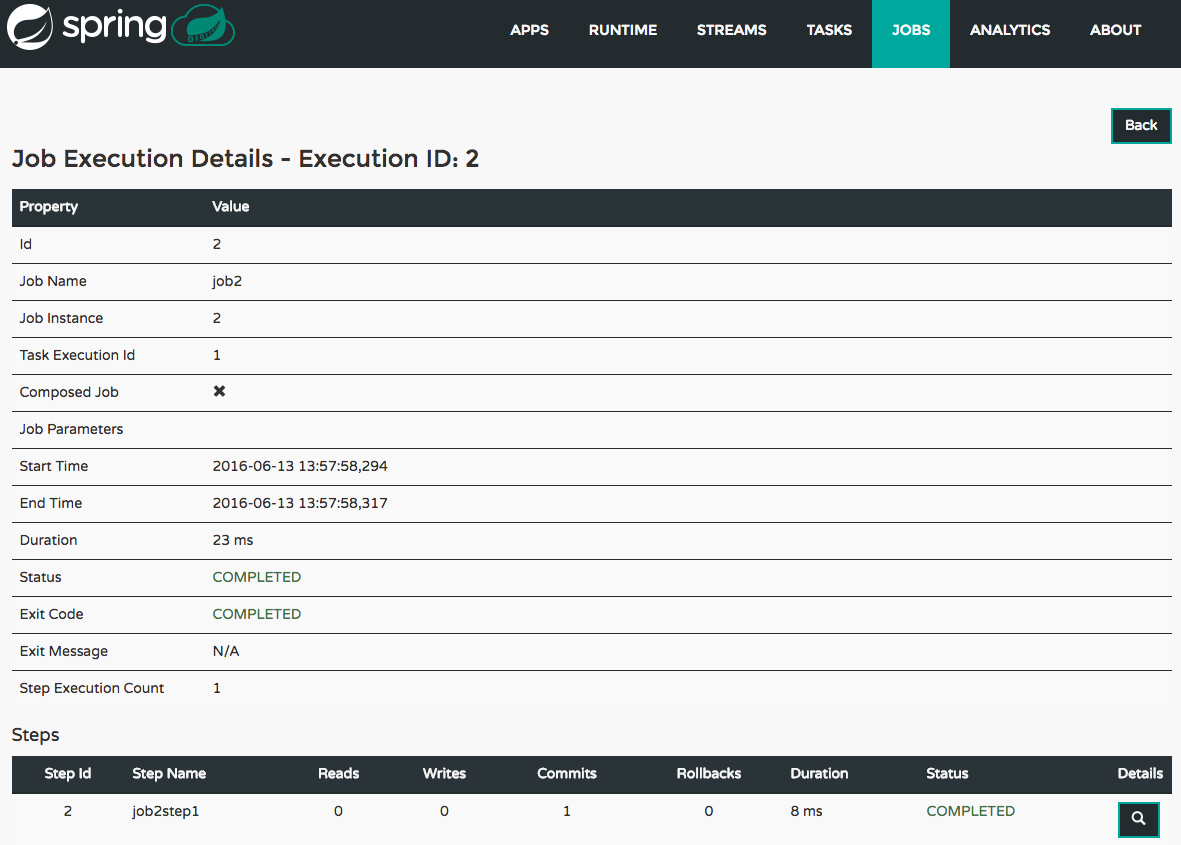
The Job Execution Details screen also contains a list of the executed steps. You can further drill into the Step Execution Details by clicking onto the magnifying glass.
25.1.2. Step execution details
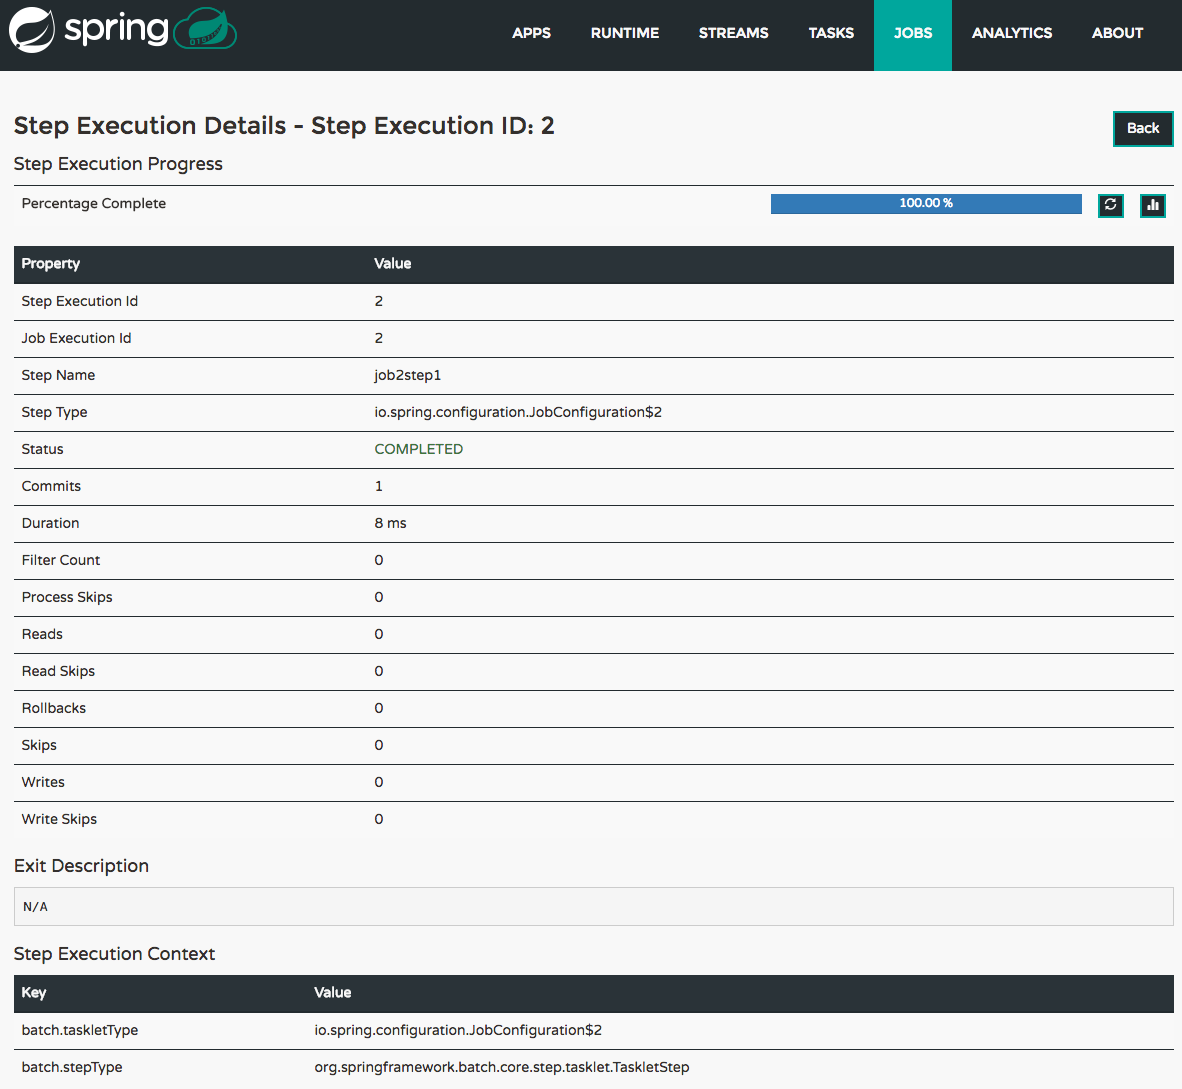
On the top of the page, you will see progress indicator the respective step, with the option to refresh the indicator. Furthermore, a link is provided to view the step execution history.
The Step Execution details screen provides a complete list of all Step Execution Context key/value pairs.
| In case of exceptions, the Exit Description field will contain additional error information. Please be aware, though, that this field can only have a maximum of 2500 characters. Therefore, in case of long exception stacktraces, trimming of error messages may occur. In that case, please refer to the server log files for further details. |
25.1.3. Step Execution Progress
On this screen, you can see a progress bar indicator in regards to the execution of the current step. Under the Step Execution History, you can also view various metrics associated with the selected step such as duration, read counts, write counts etc.
26. Analytics
The Analytics section of the Dashboard provided data visualization capabilities for the various analytics applications available in Spring Cloud Data Flow:
-
Counters
-
Field-Value Counters
-
Aggregate Counters
For example, if you create a stream with a Counter application, you can now easily create the corresponding graph from within the Dashboard tab:
-
Under
Metric Type, selectCountersfrom the select box -
Under
Stream, selecttweetcount -
Under
Visualization, select the desired chart option,Bar Chart
Using the icons to the right, you can add additional charts to the Dashboard, re-arange the order of created dashboards or remove data visualizations.
Server Implementation
27. Server Properties
The Spring Data Flow Kubernetes Server has several properties you can configure that let you control the default values to set the cpu and memory requirements for the pods. The configuration is controlled by configuration properties under the spring.cloud.deployer.kubernetes prefix. For example you might declare the following section in an application.properties file or pass them as command line arguments when starting the Server.
spring.cloud.deployer.kubernetes.memory=512Mi
spring.cloud.deployer.kubernetes.cpu=500m
See KubernetesAppDeployerProperties for more of the supported options.
Data Flow Server properties that are common across all of the Data Flow Server implementations that concern maven repository settings can also be set in a similar manner. See the section on Common Data Flow Server Properties for more information.
‘How-to’ guides
This section provides answers to some common ‘how do I do that…’ type of questions that often arise when using Spring Cloud Data Flow.
If you are having a specific problem that we don’t cover here, you might want to check out
stackoverflow.com to see if someone has
already provided an answer; this is also a great place to ask new questions (please use
the spring-cloud-dataflow tag).
We’re also more than happy to extend this section; If you want to add a ‘how-to’ you can send us a pull request.
28. Logging
Spring Cloud Data Flow is built upon several Spring projects, but ultimately the dataflow-server is a Spring Boot app, so the logging techniques that apply to any Spring Boot application are applicable here as well.
While troubleshooting, following are the two primary areas where enabling the DEBUG logs could be useful.
28.1. Deployment Logs
Spring Cloud Data Flow builds upon Spring Cloud Deployer SPI and the platform specific dataflow-server uses the respective SPI implementations. Specifically, if we were to troubleshoot deployment specific issues; such as the network errors, it’d be useful to enable the DEBUG logs at the underlying deployer and the libraries used by it.
-
For instance, if you’d like to enable DEBUG logs for the kubernetes-deployer, you’d be starting the server with following environment variable set.
LOGGING_LEVEL_ORG_SPRINGFRAMEWORK_CLOUD_DEPLOYER_SPI_KUBERNETES=DEBUG=== Application Logs
The streaming applications in Spring Cloud Data Flow are Spring Boot applications and they can be independently setup with logging configurations.
For instance, if you’d have to troubleshoot the header and payload specifics that are being passed
around source, processor and sink channels, you’d be deploying the stream with the following
options.
dataflow:>stream create foo --definition "http --logging.level.org.springframework.integration=DEBUG | transform --logging.level.org.springframework.integration=DEBUG | log --logging.level.org.springframework.integration=DEBUG" --deploy(where, org.springframework.integration is the global package for everything Spring Integration related,
which is responsible for messaging channels)
These properties can also be specified via deployment properties when deploying the stream.
dataflow:>stream deploy foo --properties "app.*.logging.level.org.springframework.integration=DEBUG"Appendices
Appendix A: Migrating from Spring XD to Spring Cloud Data Flow
A.1. Terminology Changes
| Old | New |
|---|---|
XD-Admin |
Server (implementations: local, cloud foundry, apache yarn, kubernetes, and apache mesos) |
XD-Container |
N/A |
Modules |
Applications |
Admin UI |
Dashboard |
Message Bus |
Binders |
Batch / Job |
Task |
A.2. Modules to Applications
If you have custom Spring XD modules, you’d have to refactor them to use Spring Cloud Stream and Spring Cloud Task annotations, with updated dependencies and built as normal Spring Boot "applications".
A.2.1. Custom Applications
-
Spring XD’s stream and batch modules are refactored into Spring Cloud Stream and Spring Cloud Task application-starters, respectively. These applications can be used as the reference while refactoring Spring XD modules
-
There are also some samples for Spring Cloud Stream and Spring Cloud Task applications for reference
-
If you’d like to create a brand new custom application, use the getting started guide for Spring Cloud Stream and Spring Cloud Task applications and as well as review the development guide
-
Alternatively, if you’d like to patch any of the out-of-the-box stream applications, you can follow the procedure here
A.2.2. Application Registration
-
Custom Stream/Task application requires being installed to a maven repository for Local, YARN, and CF implementations or as docker images, when deploying to Kubernetes and Mesos. Other than maven and docker resolution, you can also resolve application artifacts from
http,file, or ashdfscoordinates -
Unlike Spring XD, you do not have to upload the application bits while registering custom applications anymore; instead, you’re expected to register the application coordinates that are hosted in the maven repository or by other means as discussed in the previous bullet
-
By default, none of the out-of-the-box applications are preloaded already. It is intentionally designed to provide the flexibility to register app(s), as you find appropriate for the given use-case requirement
-
Depending on the binder choice, you can manually add the appropriate binder dependency to build applications specific to that binder-type. Alternatively, you can follow the Spring Initialzr procedure to create an application with binder embedded in it
A.2.3. Application Properties
-
counter-sink:
-
The peripheral
redisis not required in Spring Cloud Data Flow. If you intend to use thecounter-sink, thenredisbecomes required, and you’re expected to have your own runningrediscluster
-
-
field-value-counter-sink:
-
The peripheral
redisis not required in Spring Cloud Data Flow. If you intend to use thefield-value-counter-sink, thenredisbecomes required, and you’re expected to have your own runningrediscluster
-
-
aggregate-counter-sink:
-
The peripheral
redisis not required in Spring Cloud Data Flow. If you intend to use theaggregate-counter-sink, thenredisbecomes required, and you’re expected to have your own runningrediscluster
-
A.3. Message Bus to Binders
Terminology wise, in Spring Cloud Data Flow, the message bus implementation is commonly referred to as binders.
A.3.1. Message Bus
Similar to Spring XD, there’s an abstraction available to extend the binder interface. By default, we take the opinionated view of Apache Kafka and RabbitMQ as the production-ready binders and are available as GA releases.
A.3.2. Binders
Selecting a binder is as simple as providing the right binder dependency in the classpath. If you’re to choose Kafka as the binder, you’d register stream applications that are pre-built with Kafka binder in it. If you were to create a custom application with Kafka binder, you’d add the following dependency in the classpath.
<dependency>
    <groupId>org.springframework.cloud</groupId>
    <artifactId>spring-cloud-stream-binder-kafka</artifactId>
    <version>1.0.2.RELEASE</version>
</dependency>-
Spring Cloud Stream supports Apache Kafka, RabbitMQ and experimental Google PubSub and Solace JMS. All binder implementations are maintained and managed in their individual repositories
-
Every Stream/Task application can be built with a binder implementation of your choice. All the out-of-the-box applications are pre-built for both Kafka and Rabbit and they’re readily available for use as maven artifacts [Spring Cloud Stream / Spring Cloud Task or docker images [Spring Cloud Stream / Spring Cloud Task Changing the binder requires selecting the right binder dependency. Alternatively, you can download the pre-built application from this version of Spring Initializr with the desired “binder-starter” dependency
A.3.3. Named Channels
Fundamentally, all the messaging channels are backed by pub/sub semantics. Unlike Spring XD, the
messaging channels are backed only by topics or topic-exchange and there’s no representation of
queues in the new architecture.
-
${xd.module.index}is not supported anymore; instead, you can directly interact with named destinations -
stream.indexchanges to:<stream-name>.<label/app-name>-
for instance:
ticktock.0changes to:ticktock.time
-
-
“topic/queue” prefixes are not required to interact with named-channels
-
for instance:
topic:foochanges to:foo -
for instance:
stream create stream1 --definition ":foo > log"
-
A.3.4. Directed Graphs
If you’re building non-linear streams, you could take advantage of named destinations to build directed graphs.
for instance, in Spring XD:
stream create f --definition "queue:foo > transform --expression=payload+'-foo' | log" --deploy
stream create b --definition "queue:bar > transform --expression=payload+'-bar' | log" --deploy
stream create r --definition "http | router --expression=payload.contains('a')?'queue:foo':'queue:bar'" --deploy
for instance, in Spring Cloud Data Flow:
stream create f --definition ":foo > transform --expression=payload+'-foo' | log" --deploy
stream create b --definition ":bar > transform --expression=payload+'-bar' | log" --deploy
stream create r --definition "http | router --expression=payload.contains('a')?'foo':'bar'" --deploy
A.4. Batch to Tasks
A Task by definition, is any application that does not run forever, including Spring Batch jobs, and they end/stop at some point. Task applications can be majorly used for on-demand use-cases such as database migration, machine learning, scheduled operations etc. Using Spring Cloud Task, users can build Spring Batch jobs as microservice applications.
-
Spring Batch jobs from Spring XD are being refactored to Spring Boot applications a.k.a Spring Cloud Task applications
-
Unlike Spring XD, these “Tasks” don’t require explicit deployment; instead, a task is ready to be launched directly once the definition is declared
A.5. Shell/DSL Commands
| Old Command | New Command |
|---|---|
module upload |
app register / app import |
module list |
app list |
module info |
app info |
admin config server |
dataflow config server |
job create |
task create |
job launch |
task launch |
job list |
task list |
job status |
task status |
job display |
task display |
job destroy |
task destroy |
job execution list |
task execution list |
runtime modules |
runtime apps |
A.6. REST-API
| Old API | New API |
|---|---|
/modules |
/apps |
/runtime/modules |
/runtime/apps |
/runtime/modules/{moduleId} |
/runtime/apps/{appId} |
/jobs/definitions |
/task/definitions |
/jobs/deployments |
/task/deployments |
A.7. UI / Flo
The Admin-UI is now renamed as Dashboard. The URI for accessing the Dashboard is changed from localhost:9393/admin-ui to localhost:9393/dashboard
-
(New) Apps: Lists all the registered applications that are available for use. This view includes informational details such as the URI and the properties supported by each application. You can also register/unregister applications from this view
-
Runtime: Container changes to Runtime. The notion of
xd-containeris gone, replaced by out-of-the-box applications running as autonomous Spring Boot applications. The Runtime tab displays the applications running in the runtime platforms (implementations: cloud foundry, apache yarn, apache mesos, or kubernetes). You can click on each application to review relevant details about the application such as where it is running with, and what resources etc. -
Spring Flo is now an OSS product. Flo for Spring Cloud Data Flow’s “Create Stream”, the designer-tab comes pre-built in the Dashboard
-
(New) Tasks:
-
The sub-tab “Modules” is renamed to “Apps”
-
The sub-tab “Definitions” lists all the Task definitions, including Spring Batch jobs that are orchestrated as Tasks
-
The sub-tab “Executions” lists all the Task execution details similar to Spring XD’s Job executions
-
A.8. Architecture Components
Spring Cloud Data Flow comes with a significantly simplified architecture. In fact, when compared with Spring XD, there are less peripherals that are necessary to operationalize Spring Cloud Data Flow.
A.8.1. ZooKeeper
ZooKeeper is not used in the new architecture.
A.8.2. RDBMS
Spring Cloud Data Flow uses an RDBMS instead of Redis for stream/task definitions, application registration, and for job repositories.The default configuration uses an embedded H2 instance, but Oracle, DB2, SqlServer, MySQL/MariaDB, PostgreSQL, H2, and HSQLDB databases are supported. To use Oracle, DB2 and SqlServer you will need to create your own Data Flow Server using Spring Initializr and add the appropriate JDBC driver dependency.
A.8.3. Redis
Running a Redis cluster is only required for analytics functionality. Specifically, when the counter-sink,
field-value-counter-sink, or aggregate-counter-sink applications are used, it is expected to also
have a running instance of Redis cluster.
A.8.4. Cluster Topology
Spring XD’s xd-admin and xd-container server components are replaced by stream and task
applications themselves running as autonomous Spring Boot applications. The applications run natively
on various platforms including Cloud Foundry, Apache YARN, Apache Mesos, or Kubernetes. You can develop,
test, deploy, scale +/-, and interact with (Spring Boot) applications individually, and they can
evolve in isolation.
A.9. Central Configuration
To support centralized and consistent management of an application’s configuration properties, Spring Cloud Config client libraries have been included into the Spring Cloud Data Flow server as well as the Spring Cloud Stream applications provided by the Spring Cloud Stream App Starters. You can also pass common application properties to all streams when the Data Flow Server starts.
A.10. Distribution
Spring Cloud Data Flow is a Spring Boot application. Depending on the platform of your choice, you
can download the respective release uber-jar and deploy/push it to the runtime platform
(cloud foundry, apache yarn, kubernetes, or apache mesos). For example, if you’re running Spring
Cloud Data Flow on Cloud Foundry, you’d download the Cloud Foundry server implementation and do a
cf push as explained in the reference guide.
A.11. Hadoop Distribution Compatibility
The hdfs-sink application builds upon Spring Hadoop 2.4.0 release, so this application is compatible
with following Hadoop distributions.
-
Cloudera - cdh5
-
Pivotal Hadoop - phd30
-
Hortonworks Hadoop - hdp24
-
Hortonworks Hadoop - hdp23
-
Vanilla Hadoop - hadoop26
-
Vanilla Hadoop - 2.7.x (default)
A.12. YARN Deployment
Spring Cloud Data Flow can be deployed and used with Apche YARN in two different ways.
-
Deploy the server directly in a YARN cluster
-
Leverage Apache Ambari plugin to provision Spring Cloud Data Flow as a service
A.13. Use Case Comparison
Let’s review some use-cases to compare and contrast the differences between Spring XD and Spring Cloud Data Flow.
A.13.1. Use Case #1
(It is assumed both XD and SCDF distributions are already downloaded)
Description: Simple ticktock example using local/singlenode.
| Spring XD | Spring Cloud Data Flow |
|---|---|
Start
|
Start a binder of your choice Start
|
Start
|
Start
|
Create
|
Create
|
Review |
Review |
A.13.2. Use Case #2
(It is assumed both XD and SCDF distributions are already downloaded)
Description: Stream with custom module/application.
| Spring XD | Spring Cloud Data Flow |
|---|---|
Start
|
Start a binder of your choice Start
|
Start
|
Start
|
Register custom “processor” module to transform payload to a desired format
|
Register custom “processor” application to transform payload to a desired format
|
Create a stream with custom module
|
Create a stream with custom application
|
Review results in the |
Review results by tailing the |
A.13.3. Use Case #3
(It is assumed both XD and SCDF distributions are already downloaded)
Description: Simple batch-job.
| Spring XD | Spring Cloud Data Flow |
|---|---|
Start
|
Start
|
Start
|
Start
|
Register custom “batch-job” module
|
Register custom “batch-job” as task application
|
Create a job with custom batch-job module
|
Create a task with custom batch-job application
|
Deploy job
|
NA |
Launch job
|
Launch task
|
Review results in the |
Review results by tailing the |
Appendix B: Building
To build the source you will need to install JDK 1.8.
The build uses the Maven wrapper so you don’t have to install a specific version of Maven. To enable the tests for Redis you should run the server before bulding. See below for more information on how to run Redis.
The main build command is
$ ./mvnw clean install
You can also add '-DskipTests' if you like, to avoid running the tests.
You can also install Maven (>=3.3.3) yourself and run the mvn command
in place of ./mvnw in the examples below. If you do that you also
might need to add -P spring if your local Maven settings do not
contain repository declarations for spring pre-release artifacts.
|
Be aware that you might need to increase the amount of memory
available to Maven by setting a MAVEN_OPTS environment variable with
a value like -Xmx512m -XX:MaxPermSize=128m. We try to cover this in
the .mvn configuration, so if you find you have to do it to make a
build succeed, please raise a ticket to get the settings added to
source control.
|
The projects that require middleware generally include a
docker-compose.yml, so consider using
Docker Compose to run the middeware servers
in Docker containers. See the README in the
scripts demo
repository for specific instructions about the common cases of mongo,
rabbit and redis.
B.1. Documentation
There is a "full" profile that will generate documentation. You can build just the documentation by executing
$ ./mvnw clean package -DskipTests -P full -pl spring-cloud-dataflow-server-kubernetes-docs -am
B.2. Working with the code
If you don’t have an IDE preference we would recommend that you use Spring Tools Suite or Eclipse when working with the code. We use the m2eclipe eclipse plugin for maven support. Other IDEs and tools should also work without issue.
B.2.1. Importing into eclipse with m2eclipse
We recommend the m2eclipe eclipse plugin when working with eclipse. If you don’t already have m2eclipse installed it is available from the "eclipse marketplace".
Unfortunately m2e does not yet support Maven 3.3, so once the projects
are imported into Eclipse you will also need to tell m2eclipse to use
the .settings.xml file for the projects. If you do not do this you
may see many different errors related to the POMs in the
projects. Open your Eclipse preferences, expand the Maven
preferences, and select User Settings. In the User Settings field
click Browse and navigate to the Spring Cloud project you imported
selecting the .settings.xml file in that project. Click Apply and
then OK to save the preference changes.
Alternatively you can copy the repository settings from .settings.xml into your own ~/.m2/settings.xml.
|
B.2.2. Importing into eclipse without m2eclipse
If you prefer not to use m2eclipse you can generate eclipse project metadata using the following command:
$ ./mvnw eclipse:eclipse
The generated eclipse projects can be imported by selecting import existing projects
from the file menu.
Appendix C: Contributing
Spring Cloud is released under the non-restrictive Apache 2.0 license, and follows a very standard Github development process, using Github tracker for issues and merging pull requests into master. If you want to contribute even something trivial please do not hesitate, but follow the guidelines below.
C.1. Sign the Contributor License Agreement
Before we accept a non-trivial patch or pull request we will need you to sign the contributor’s agreement. Signing the contributor’s agreement does not grant anyone commit rights to the main repository, but it does mean that we can accept your contributions, and you will get an author credit if we do. Active contributors might be asked to join the core team, and given the ability to merge pull requests.
C.2. Code Conventions and Housekeeping
None of these is essential for a pull request, but they will all help. They can also be added after the original pull request but before a merge.
-
Use the Spring Framework code format conventions. If you use Eclipse you can import formatter settings using the
eclipse-code-formatter.xmlfile from the Spring Cloud Build project. If using IntelliJ, you can use the Eclipse Code Formatter Plugin to import the same file. -
Make sure all new
.javafiles to have a simple Javadoc class comment with at least an@authortag identifying you, and preferably at least a paragraph on what the class is for. -
Add the ASF license header comment to all new
.javafiles (copy from existing files in the project) -
Add yourself as an
@authorto the .java files that you modify substantially (more than cosmetic changes). -
Add some Javadocs and, if you change the namespace, some XSD doc elements.
-
A few unit tests would help a lot as well — someone has to do it.
-
If no-one else is using your branch, please rebase it against the current master (or other target branch in the main project).
-
When writing a commit message please follow these conventions, if you are fixing an existing issue please add
Fixes gh-XXXXat the end of the commit message (where XXXX is the issue number).