In this demonstration, you will learn how Micrometer can help to monitor your Spring Cloud Data Flow (SCDF) streams using InfluxDB and Grafana.
InfluxDB is a real-time storage for time-series data, such as SCDF metrics. It supports downsampling, automatically expiring and deleting unwanted data, as well as backup and restore. Analysis of data is done via a SQL-like query language.
Grafana is open source metrics Dashboard platform. It supports multiple backend time-series databases including InluxDB.
The architecture (Fig.1) builds on the Spring Boot Micrometer functionality. When a micrometer-registry-influx dependency is found on the classpath the Spring Boot auto-configures the metrics export for InfluxDB.
The Spring Cloud Stream (SCSt) applications inherit the mircometer functionality, allowing them to compute and send various application metrics to the configured time-series database.
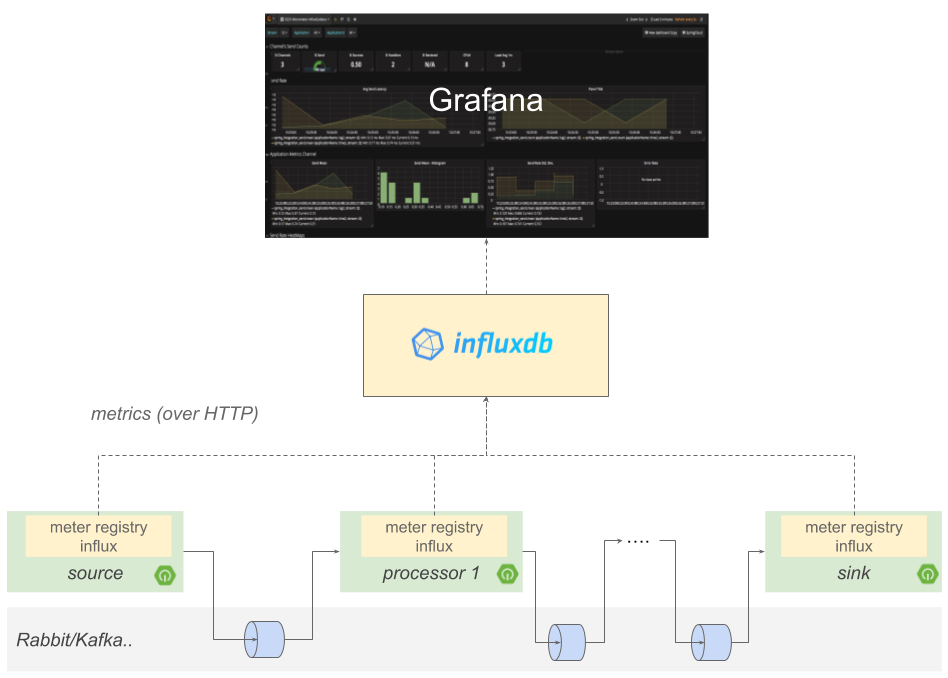
Out of the box, SCSt sends core metrics such as CPU, Memory, MVC and Health to name some. Among those the Spring Integration metrics allows computing the Rate and the Latency of the messages in the SCDF streams.
![[Note]](images/note.png) | Note |
|---|---|
Unlike Spring Cloud Data Flow Metrics Collector, metrics here are sent synchronously over HTTP not through a Binder channel topic. |
All Spring Cloud Stream App Starers enrich the standard dimensional tags with the following SCDF specific tags:
| tag name | SCDF property | default value |
|---|---|---|
stream.name | spring.cloud.dataflow.stream.name | unknown |
application.name | spring.cloud.dataflow.stream.app.label | unknown |
instance.index | instance.index | 0 |
application.guid | spring.cloud.application.guid | unknown |
application.type | spring.cloud.dataflow.stream.app.type | unknown |
| Note |
|---|---|
For custom app starters that don’t extend from the core parent, you should add the |
Below we will present the steps to prep, configure the demo of Spring Cloud Data Flow’s Local server integration with InfluxDB. For other deployment environment, such as Cloud Foundry or Kubernetes, additional configurations might be required.
- A Running Data Flow Shell
The Spring Cloud Data Flow Shell is available for download or you can build it yourself.
| Note |
|---|---|
the Spring Cloud Data Flow Shell and Local server implementation are in the same repository and are both built by running |
To run the Shell open a new terminal session:
$ cd <PATH/TO/SPRING-CLOUD-DATAFLOW-SHELL-JAR>
$ java -jar spring-cloud-dataflow-shell-<VERSION>.jar
  ____                              ____ _                __
 / ___| _ __  _ __(_)_ __   __ _   / ___| | ___  _   _  __| |
 \___ \| '_ \| '__| | '_ \ / _` | | |   | |/ _ \| | | |/ _` |
  ___) | |_) | |  | | | | | (_| | | |___| | (_) | |_| | (_| |
 |____/| .__/|_|  |_|_| |_|\__, |  \____|_|\___/ \__,_|\__,_|
  ____ |_|    _          __|___/                 __________
 |  _ \  __ _| |_ __ _  |  ___| | _____      __  \ \ \ \ \ \
 | | | |/ _` | __/ _` | | |_  | |/ _ \ \ /\ / /   \ \ \ \ \ \
 | |_| | (_| | || (_| | |  _| | | (_) \ V  V /    / / / / / /
 |____/ \__,_|\__\__,_| |_|   |_|\___/ \_/\_/    /_/_/_/_/_/


Welcome to the Spring Cloud Data Flow shell. For assistance hit TAB or type "help".
dataflow:>
| Note |
|---|---|
The Spring Cloud Data Flow Shell is a Spring Boot application that connects to the Data Flow Server’s REST API and supports a DSL that simplifies the process of defining a stream or task and managing its lifecycle. Most of these samples use the shell. If you prefer, you can use the Data Flow UI localhost:9393/dashboard, (or wherever it the server is hosted) to perform equivalent operations. |
- A running local Data Flow Server
The Local Data Flow Server is Spring Boot application available for download or you can build it yourself.
If you build it yourself, the executable jar will be in spring-cloud-dataflow-server-local/target
To run the Local Data Flow server Open a new terminal session:
$cd  <PATH/TO/SPRING-CLOUD-DATAFLOW-LOCAL-JAR>
$java -jar spring-cloud-dataflow-server-local-<VERSION>.jar
- Running instance of Kafka
Spring Cloud Stream 2.x based Time and Log applications starters, pre-built with
io.micrometer:micrometer-registry-influxdependency.Note Next versions of the SCSt App Initializr utility would add support for Micrometer dependencies to facilitate the injection of micrometer-registries with SCSt apps.
Register
timeandlogapplications that are pre-built withio.micrometer:micrometer-registry-influx. The next version of SCSt App Initializr allows adding Micrometer registry dependencies as well.app register --name time2 --type source --uri file://<path-to-your-time-app>/time-source-kafka-2.0.0.BUILD-SNAPSHOT.jar --metadata-uri file://<path-to-your-time-app>/time-source-kafka-2.0.0.BUILD-SNAPSHOT-metadata.jar app register --name log2 --type sink --uri file://<path-to-your-log-app>/log-sink-kafka-2.0.0.BUILD-SNAPSHOT.jar --metadata-uri file://<path-to-your-log-app>/log-sink-kafka-2.0.0.BUILD-SNAPSHOT-metadata.jar
Create InfluxDB and Grafana Docker containers
docker run -d --name grafana -p 3000:3000 grafana/grafana:5.1.0

docker run -d --name influxdb -p 8086:8086 influxdb:1.5.2-alpine
Create and deploy the following stream
dataflow:>stream create --name t2 --definition "time2 | log2"

dataflow:>stream deploy --name t2 --properties "app.*.management.metrics.export.influx.db=myinfluxdb"
The
app.*.management.metrics.export.influx.db=myinfluxdbinstructs thetime2andlog2apps to use themyinfluxdbdatabase (created automatically).By default, the InfluxDB server runs on
localhost:8086. You can add theapp.*.management.metrics.export.influx.uri={influxbb-server-url}property to alter the default location.You can connect to the InfluxDB and explore the measurements
docker exec -it influxdb /bin/bash
root:/# influx
> show databases
> use myinfluxdb
> show measurements
> select * from spring_integration_send limit 10
Configure Grafana
- Open Grafana UI (localhost:3000) and log-in (user:
admin, password:admin). Create InfluxDB datasource called:
influx_auto_DataFlowMetricsCollectorthat connects to ourmyinfluxdbinflux database.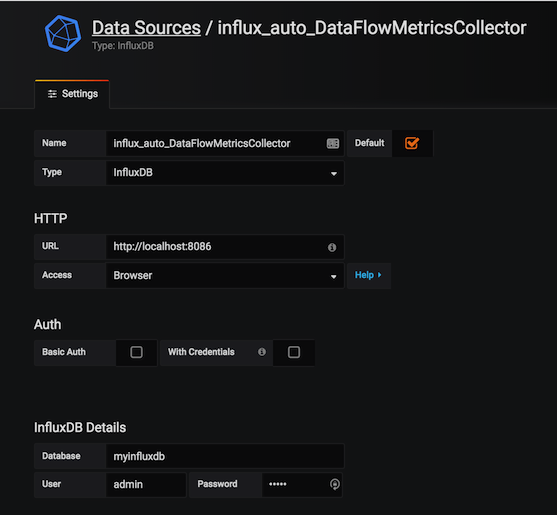
Table 9.1. DataSource Properties
Name
influx_auto_DataFlowMetricsCollector
Type
InfluxDB
Host
Access
Browser
Database
myinfluxdb
User (DB)
admin
Password (DB)
admin
Note For previous
Grafana 4.xset theAccessproperty todirectinstead.Import the scdf-influxdb-dashboard.json dashboard
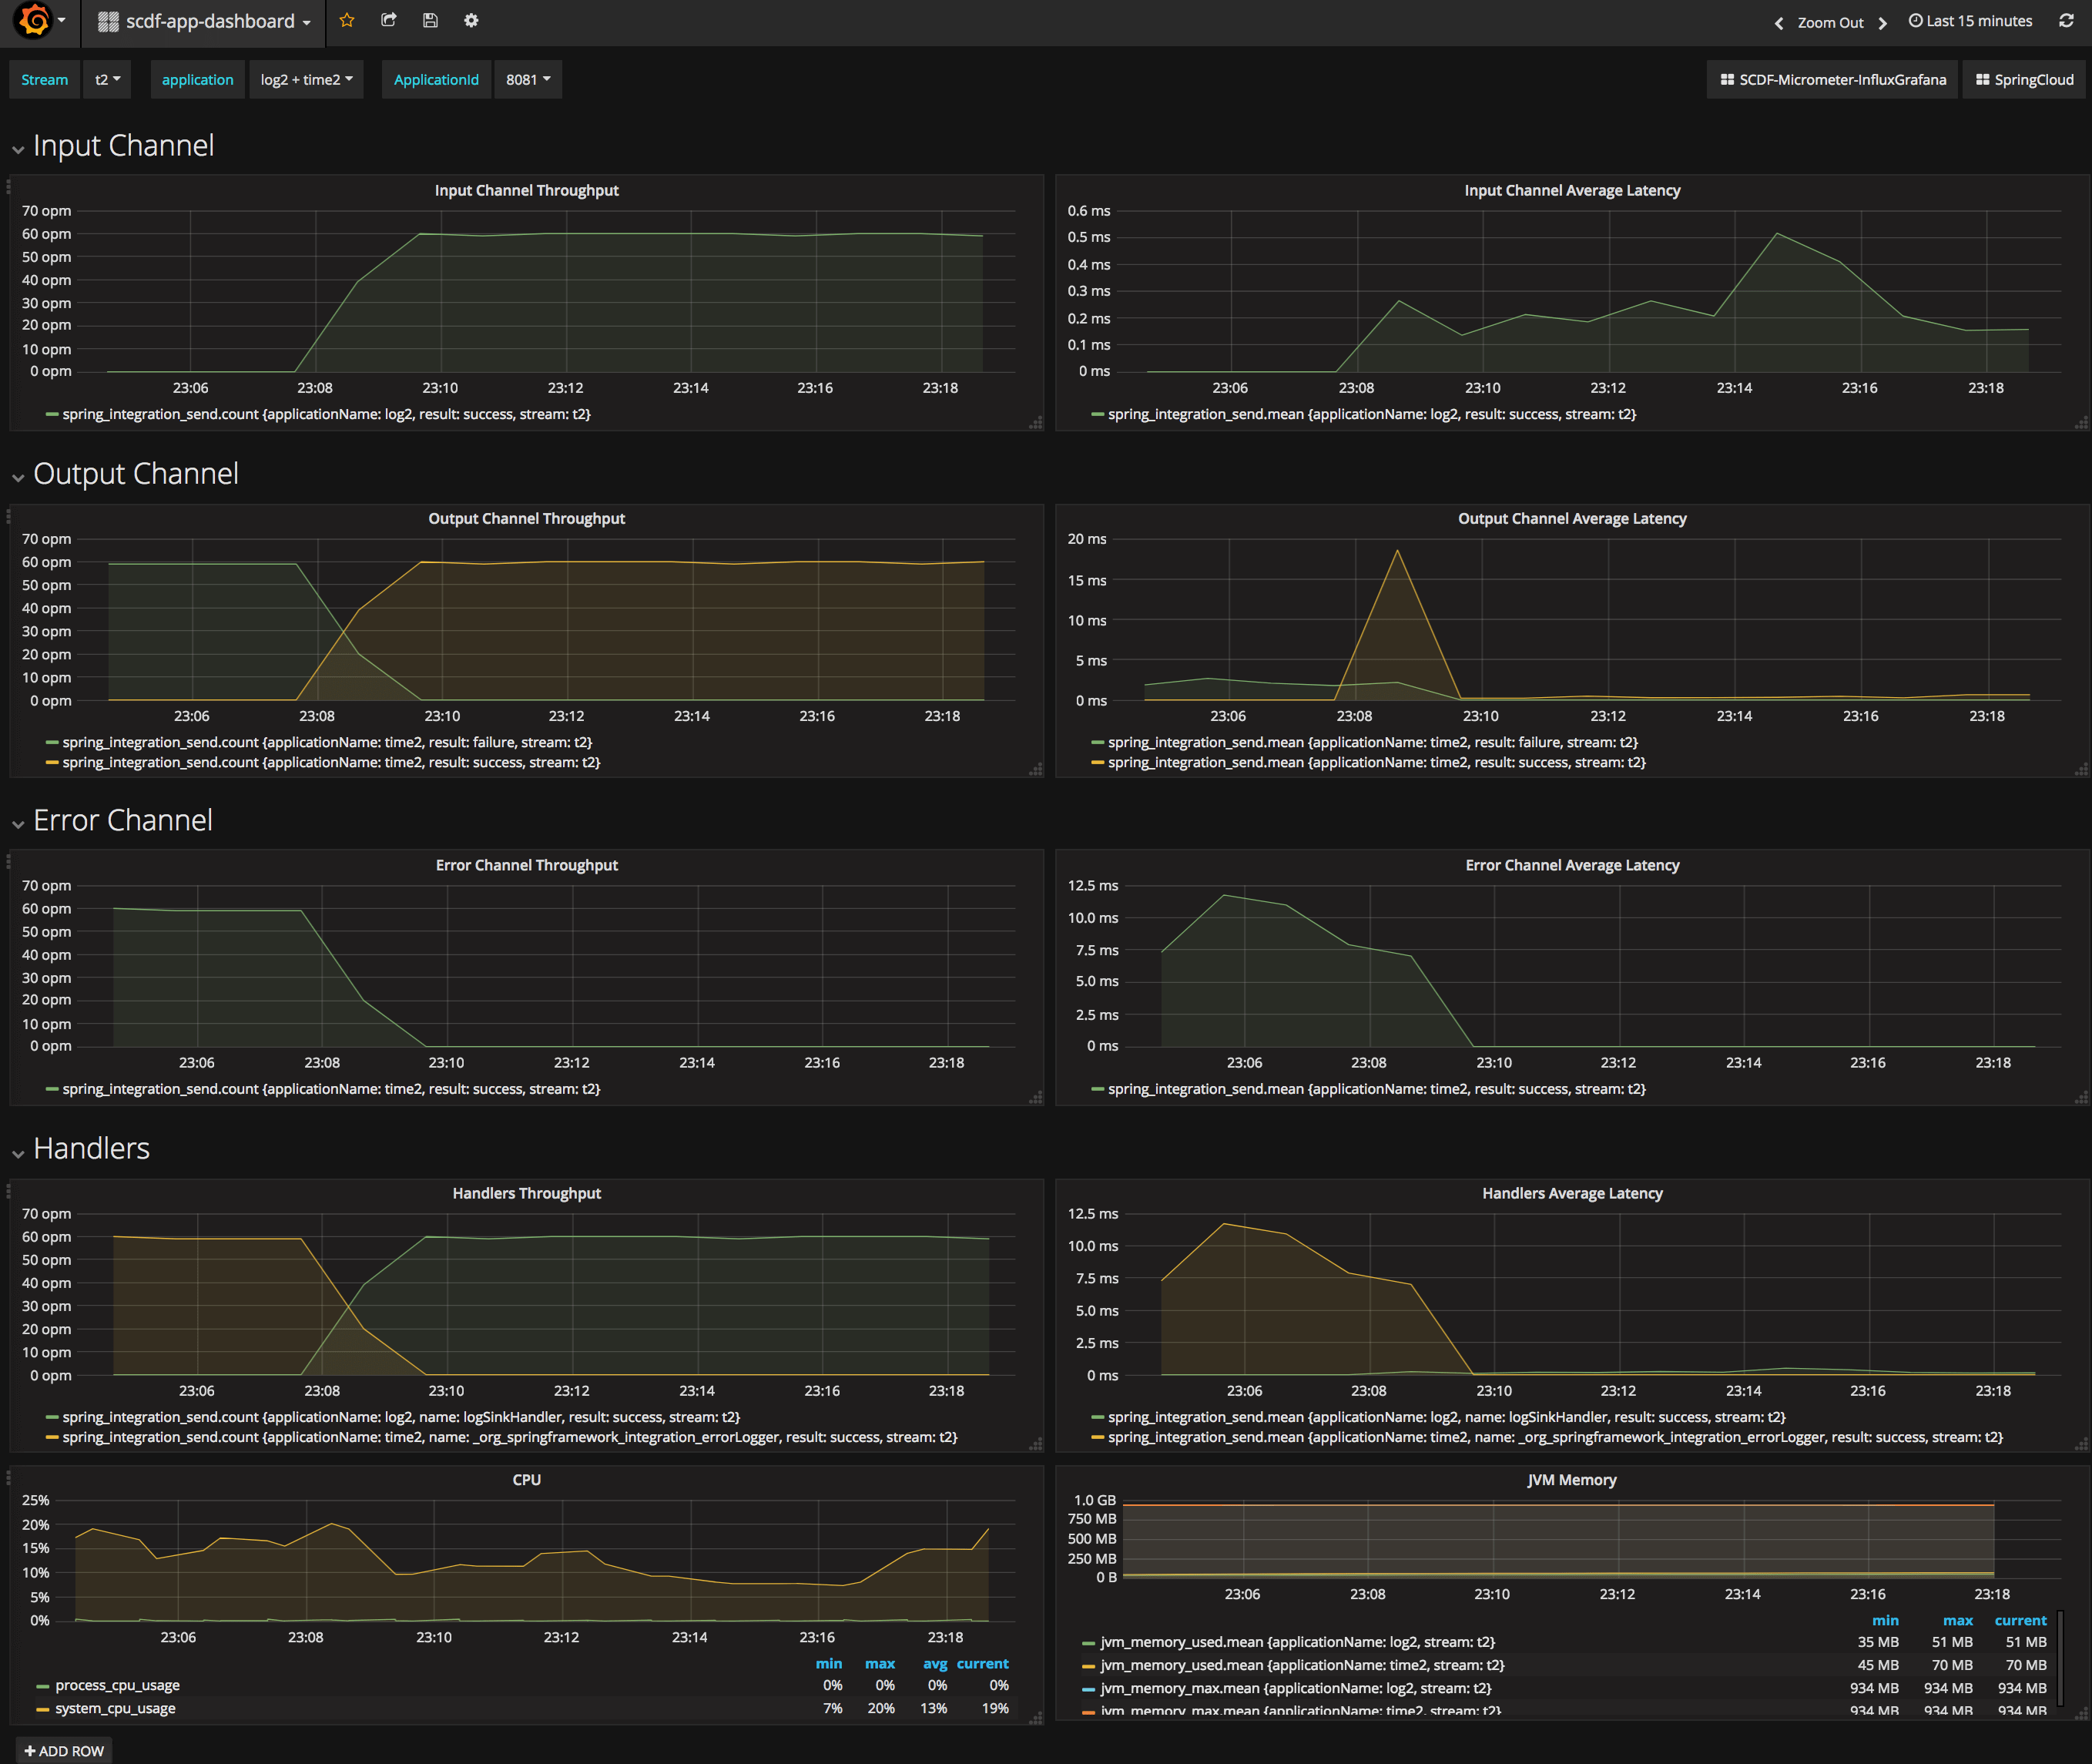
- Open Grafana UI (localhost:3000) and log-in (user:
In this demonstration, you will learn how Micrometer can help to monitor your Spring Cloud Data Flow Streams using Prometheus and Grafana.
Prometheus is time series database used for monitoring of highly dynamic service-oriented architectures. In a world of microservices, its support for multi-dimensional data collection and querying is a particular strength.
Grafana is open source metrics Dashboard platform. It supports multiple backend time-series databases including Prometheus.
The architecture (Fig.1) builds on the Spring Boot Micrometer functionality. When a micrometer-registry-prometheus dependency is found on the classpath the Spring Boot auto-configures the metrics export for Prometheus.
The Spring Cloud Stream (SCSt) applications inherit the mircometer functionality, allowing them to compute and send various application metrics to the configured time-series database.
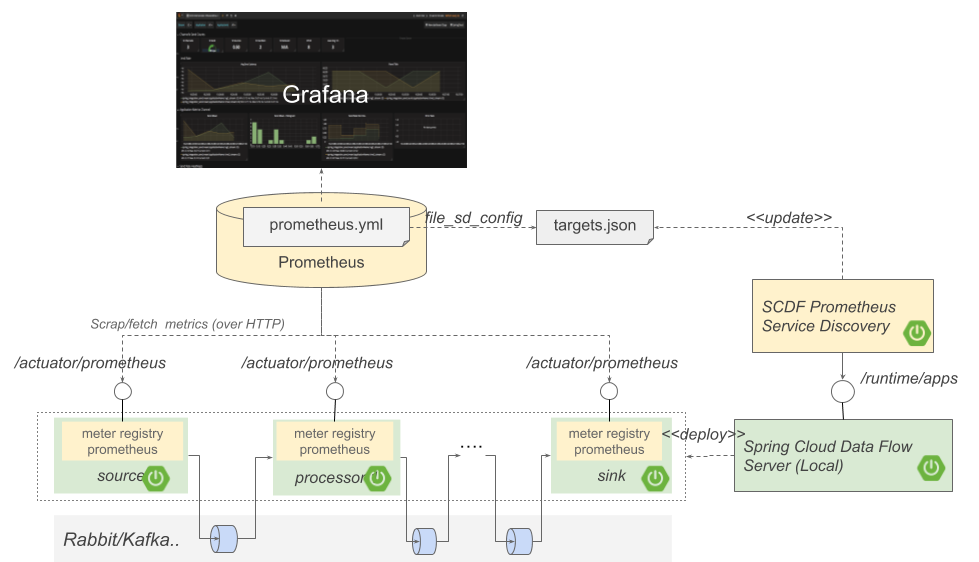
Out of the box, SCSt sends core metrics such as CPU, Memory, MVC and Health to name some. Among those the Spring Integration metrics allows computing the Rate and the Latency of the messages in the SCDF streams.
| Note |
|---|---|
Unlike Spring Cloud Data Flow Metrics Collector, metrics here are sent synchronously over HTTP not through a Binder channel topic. |
All Spring Cloud Stream App Starers enrich the standard dimensional tags with the following SCDF specific tags:
| tag name | SCDF property | default value |
|---|---|---|
stream.name | spring.cloud.dataflow.stream.name | unknown |
application.name | spring.cloud.dataflow.stream.app.label | unknown |
instance.index | instance.index | 0 |
application.guid | spring.cloud.application.guid | unknown |
application.gype | spring.cloud.dataflow.stream.app.type | unknown |
| Note |
|---|---|
For custom app starters that don’t extend from the core parent, you should add the |
Prometheus employs the pull-metrics model, called metrics scraping. Spring Boot provides an actuator endpoint available at /actuator/prometheus to present a Prometheus scrape with the appropriate format.
Furthermore Prometheus requires a mechanism to discover the target applications to be monitored (e.g. the URLs of the SCSt app instances). Targets may be statically configured via the static_configs parameter or dynamically discovered using one of the supported service-discovery mechanisms.
The SCDF Prometheus Service Discovery is a standalone (Spring Boot) service, that uses the runtime/apps endpoint to retrieve the URLs of the running SCDF applications and generate targets.json file. The targets.json file is compliant with the <file_sd_config> Prometheus discovery format.
Below we will present the steps to prepare, configure the demo of Spring Cloud Data Flow’s Local server integration with Prometheus. For other deployment environment, such as Cloud Foundry or Kubernetes, additional configurations might be required.
- A Running Data Flow Shell
The Spring Cloud Data Flow Shell is available for download or you can build it yourself.
| Note |
|---|---|
the Spring Cloud Data Flow Shell and Local server implementation are in the same repository and are both built by running |
To run the Shell open a new terminal session:
$ cd <PATH/TO/SPRING-CLOUD-DATAFLOW-SHELL-JAR>
$ java -jar spring-cloud-dataflow-shell-<VERSION>.jar
  ____                              ____ _                __
 / ___| _ __  _ __(_)_ __   __ _   / ___| | ___  _   _  __| |
 \___ \| '_ \| '__| | '_ \ / _` | | |   | |/ _ \| | | |/ _` |
  ___) | |_) | |  | | | | | (_| | | |___| | (_) | |_| | (_| |
 |____/| .__/|_|  |_|_| |_|\__, |  \____|_|\___/ \__,_|\__,_|
  ____ |_|    _          __|___/                 __________
 |  _ \  __ _| |_ __ _  |  ___| | _____      __  \ \ \ \ \ \
 | | | |/ _` | __/ _` | | |_  | |/ _ \ \ /\ / /   \ \ \ \ \ \
 | |_| | (_| | || (_| | |  _| | | (_) \ V  V /    / / / / / /
 |____/ \__,_|\__\__,_| |_|   |_|\___/ \_/\_/    /_/_/_/_/_/


Welcome to the Spring Cloud Data Flow shell. For assistance hit TAB or type "help".
dataflow:>
| Note |
|---|---|
The Spring Cloud Data Flow Shell is a Spring Boot application that connects to the Data Flow Server’s REST API and supports a DSL that simplifies the process of defining a stream or task and managing its lifecycle. Most of these samples use the shell. If you prefer, you can use the Data Flow UI localhost:9393/dashboard, (or wherever it the server is hosted) to perform equivalent operations. |
- A running local Data Flow Server
The Local Data Flow Server is Spring Boot application available for download or you can build it yourself.
If you build it yourself, the executable jar will be in spring-cloud-dataflow-server-local/target
To run the Local Data Flow server Open a new terminal session:
$cd  <PATH/TO/SPRING-CLOUD-DATAFLOW-LOCAL-JAR>
$java -jar spring-cloud-dataflow-server-local-<VERSION>.jar
- Running instance of Kafka
Spring Cloud Stream 2.x based Time and Log applications starters, pre-built with
io.micrometer:micrometer-registry-prometheusdependency.Note Next versions of the SCSt App Initializr utility would add support for Micrometer dependencies to facilitate the injection of micrometer-registries with SCSt apps.
Register
timeandlogapplications that are pre-built withio.micrometer:micrometer-registry-prometheus. The next version of SCSt App Initializr allows adding Micrometer registry dependencies as well.app register --name time2 --type source --uri file://<path-to-your-time-app>/time-source-kafka-2.0.0.BUILD-SNAPSHOT.jar --metadata-uri file://<path-to-your-time-app>/time-source-kafka-2.0.0.BUILD-SNAPSHOT-metadata.jar app register --name log2 --type sink --uri file://<path-to-your-log-app>/log-sink-kafka-2.0.0.BUILD-SNAPSHOT.jar --metadata-uri file://<path-to-your-log-app>/log-sink-kafka-2.0.0.BUILD-SNAPSHOT-metadata.jar
Create and deploy the following stream
dataflow:>stream create --name t2 --definition "time2 | log2"

dataflow:>stream deploy --name t2 --properties "app.*.management.endpoints.web.exposure.include=prometheus,app.*.spring.autoconfigure.exclude=org.springframework.boot.autoconfigure.security.servlet.SecurityAutoConfiguration"
The deployment properties make sure that the prometheus actuator is enabled and the Spring Boot security is disabled
Build and start the SCDF Prometheus Service Discovery application
Build the spring-cloud-dataflow-prometheus-service-discover project form: github.com/spring-cloud/spring-cloud-dataflow-samples/micrometer/spring-cloud-dataflow-prometheus-service-discovery
cd ./spring-cloud-dataflow-samples/micrometer/spring-cloud-dataflow-prometheus-service-discovery
./mvnw clean install
For convenience, the final spring-cloud-dataflow-prometheus-service-discovery-0.0.1-SNAPSHOT.jar artifact is provided with this sample.
Start the service discovery application:
java -jar ./target/spring-cloud-dataflow-prometheus-service-discovery-0.0.1-SNAPSHOT.jar \
--metrics.prometheus.target.discovery.url=http://localhost:9393/runtime/apps \
--metrics.prometheus.target.file.path=/tmp/targets.json \
--metrics.prometheus.target.refresh.rate=10000 \
--metrics.prometheus.target.mode=local
It will connect to the SCDF runtime url, and generates /tmp/targets.json files every 10 sec.
Create Prometheus configuration file (prometheus-local-file.yml)
global:
  scrape_interval:     15s # Set the scrape interval to every 15 seconds. Default is every 1 minute.
  evaluation_interval: 15s # Evaluate rules every 15 seconds. The default is every 1 minute.
  # scrape_timeout is set to the global default (10s).

# A scrape configuration containing exactly one endpoint to scrape:
scrape_configs:
  # The job name is added as a label `job=<job_name>` to any timeseries scraped from this config.
  - job_name: 'scdf'
    metrics_path: '/actuator/prometheus'
    file_sd_configs:
      - files:
        - targets.json
        refresh_interval: 30s
Configure the file_sd_config discovery mechanism using the generated targets.json:
Start Prometheus
docker run -d --name prometheus \
 -p 9090:9090 \
 -v <full-path-to>/prometheus-local-file.yml:/etc/prometheus/prometheus.yml \
 -v /tmp/targets.json:/etc/prometheus/targets.json \
 prom/prometheus:v2.2.1
Pass the prometheus.yml and map the /tmp/targets.json into /etc/prometheus/targets.json
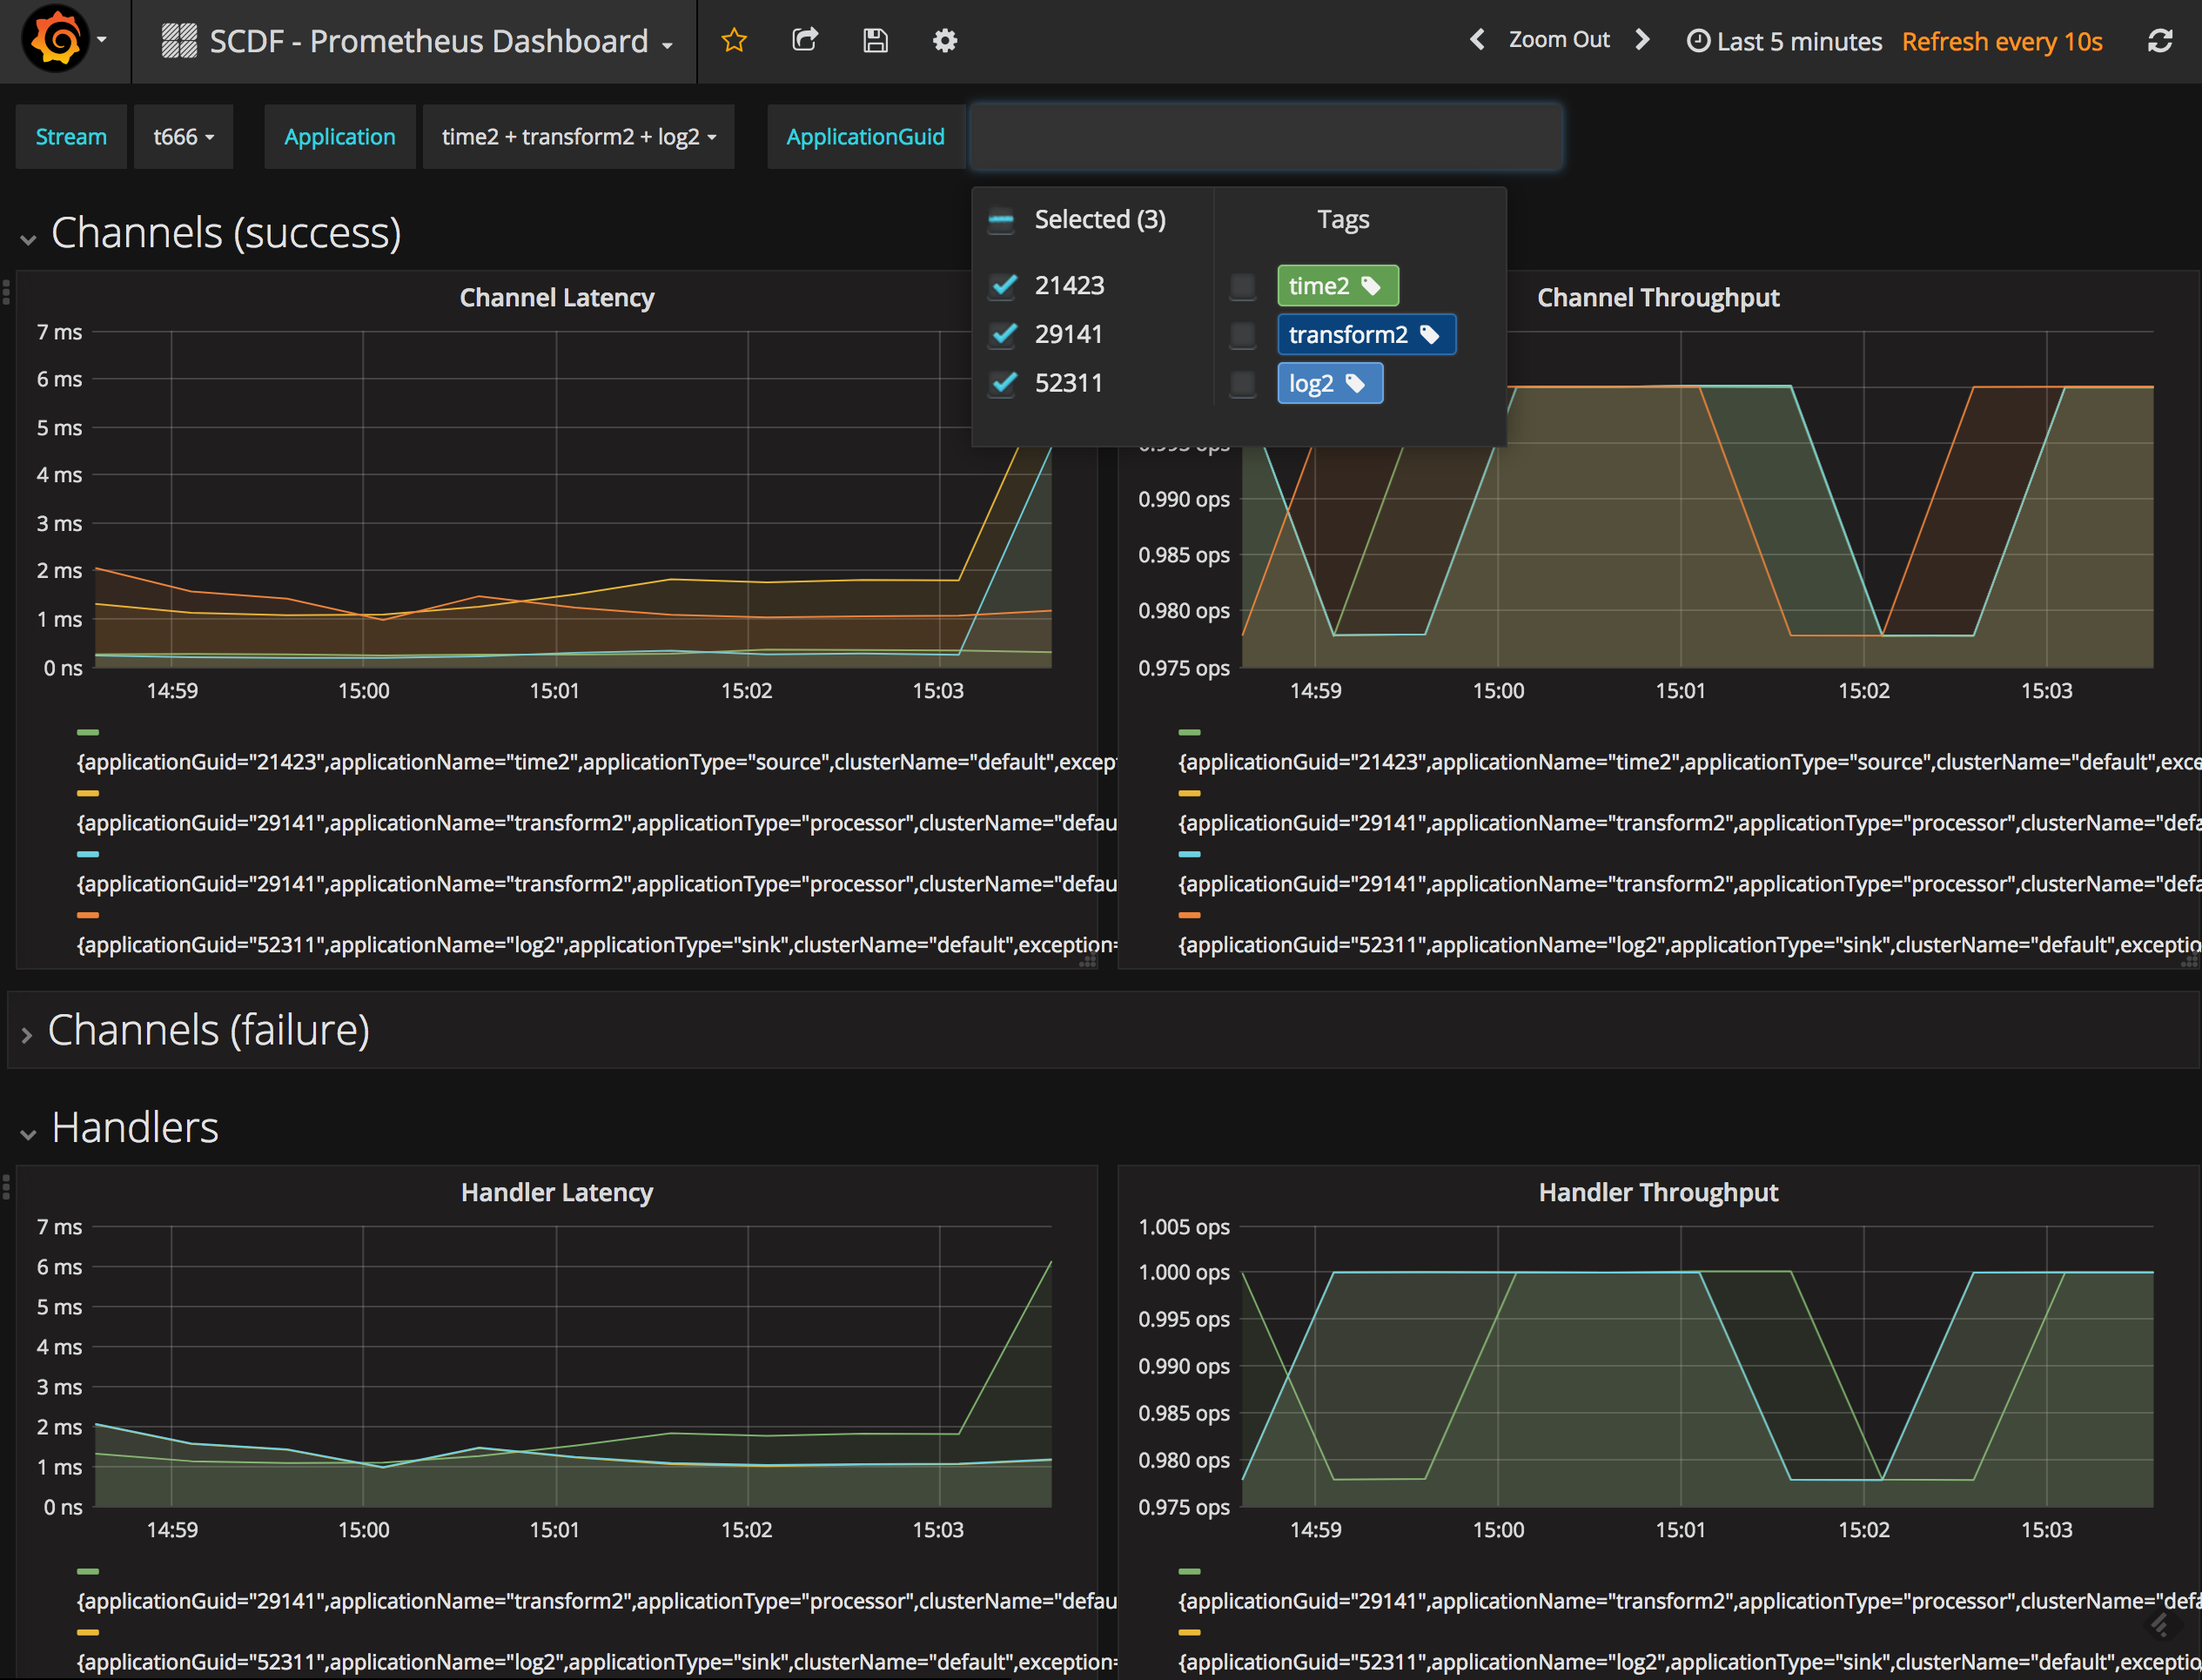
Use the management UI: localhost:9090/graph to verify that SCDF apps metrics have been collected:
# Throughput
rate(spring_integration_send_seconds_count{type="channel"}[60s])

# Latency
rate(spring_integration_send_seconds_sum{type="channel"}[60s])/rate(spring_integration_send_seconds_count{type="channel"}[60s])
Start Grafana Docker containers
docker run -d --name grafana -p 3000:3000 grafana/grafana:5.1.0
Configure Grafana
- Open Grafana UI (localhost:3000) and log-in (user:
admin, password:admin). Create Prometheus datasource called:
ScdfPrometheusNote For previous
Grafana 4.xset theAccessproperty todirectinstead.Import the scdf-prometheus-grafana-dashboard.json dashboard
- Open Grafana UI (localhost:3000) and log-in (user: