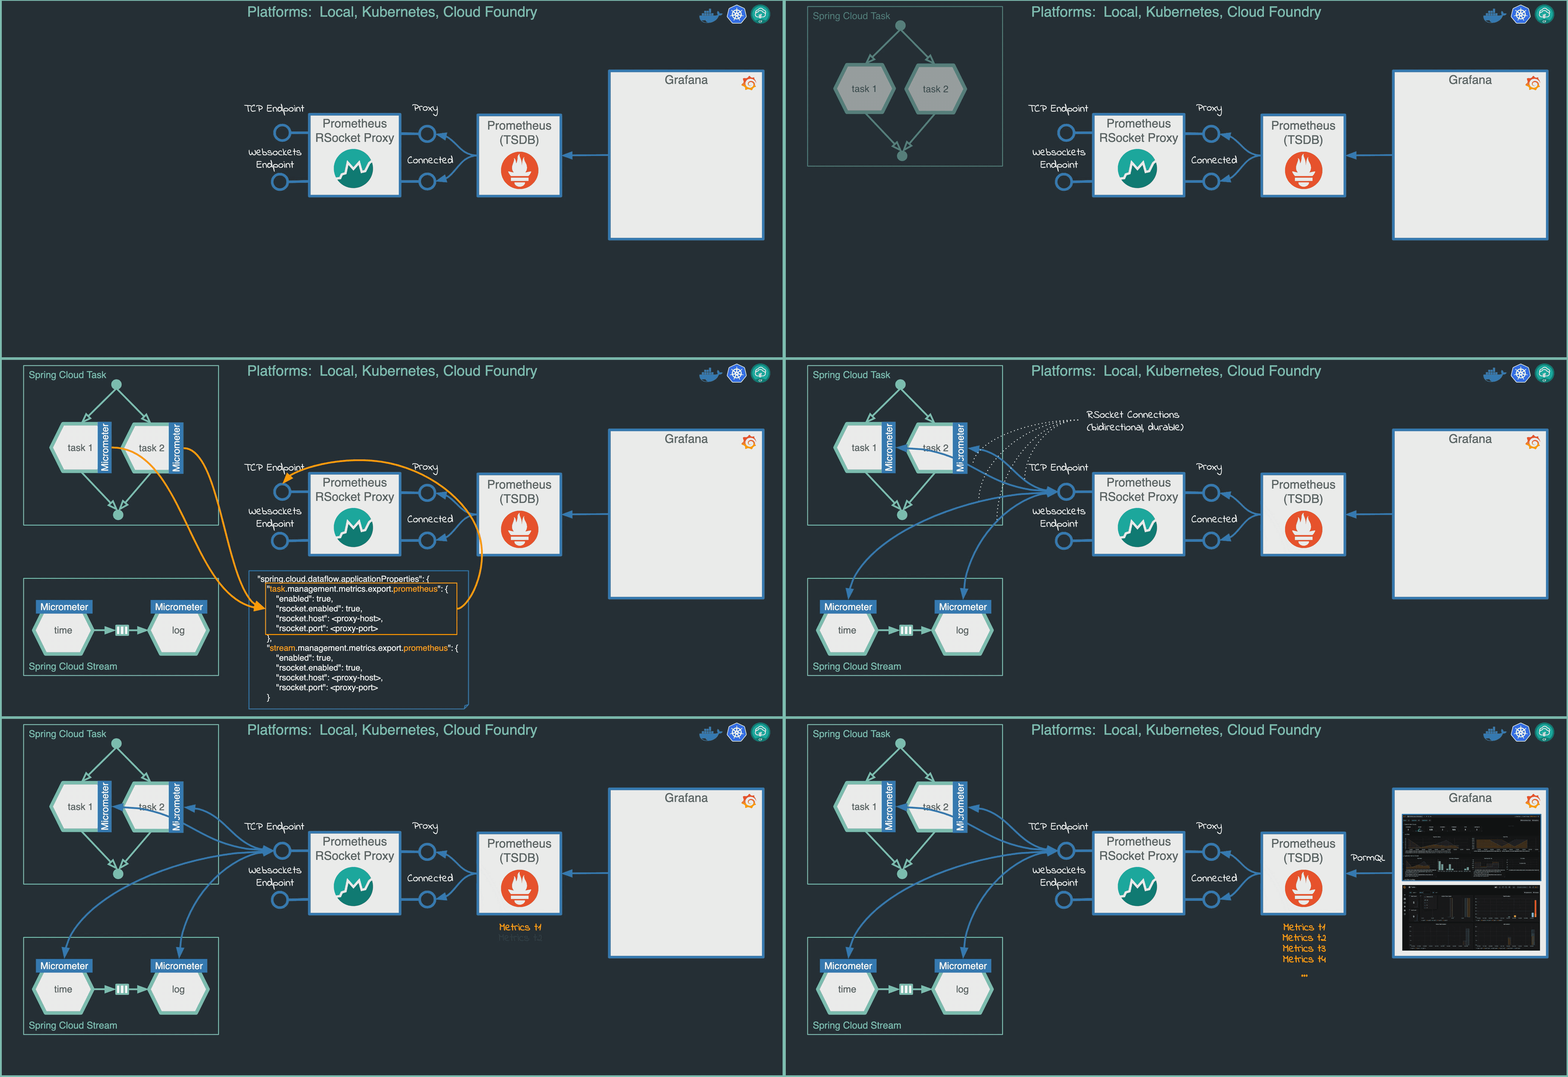
The Data Flow Monitoring Architecture is designed around the Micrometer library and is configured to support two of the most popular monitoring systems, InfluxDB, Prometheus. To help you get started monitoring Streams and Tasks, Data Flow provides Grafana Dashboards that you can customize for your needs.

Following links will provide you with information about installing, enabling and using the monitoring across the Local, Kubernetes and Cloud Foundry platforms for Streams and Tasks:
All provided Stream application starters are configured for Prometheus and InfluxDB.
To integrate custom applications with the Data Flow Monitoring you can follow the monitoring-samples projects:
- The stream-apps shows how to enable monitoring for custom built source, processor and sink apps.
- The task-apps sample shows how to enable monitoring for custom built task apps.