Demonstrate how to monitor your Spring Cloud Data Flow (SCDF) streams using InfluxDB, Prometheus and Grafana.
The Data Flow 2.x metrics architecture is designed around the Micrometer library and provides support for two of the most popular monitoring systems, Prometheus and InfluxDB. Also to help you get started monitoring Streams, Data Flow provides Grafana Dashboards you can install and customize for your needs. Support for monitoring Tasks is on the roadmap.
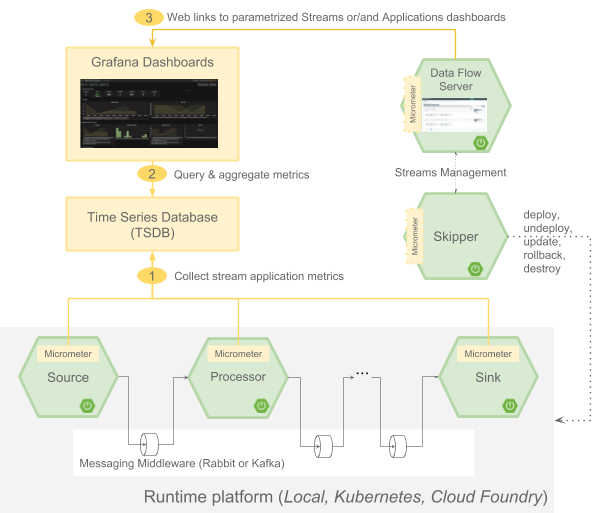
The general architecture of how applications are monitored is shown below.
You can find more information in the SCDF Stream Monitoring reference manual.
- Prometheus - pull based time series database used for monitoring of highly dynamic service-oriented architectures. In a world of microservices, its support for multi-dimensional data collection and querying is a particular strength.
- InfluxDB is a popular open-source push based time series database. It supports downsampling, automatically expiring and deleting unwanted data, as well as backup and restore. Analysis of data is done via a SQL-like query language.
- Grafana is open source metrics Dashboard platform. It supports multiple backend time-series databases including InluxDB and Prometheus.
Demonstration, how to monitor your Spring Cloud Data Flow (SCDF) streams using InfluxDB and Grafana.
By default the Data Flow 2.0+ docker-compose configures Stream monitoring with InfluxDB and pre-built dashboards for Grafana.
For further instructions about Data Flow monitoring, follow the Streams Monitoring InfluxDB section.
In this demonstration, you will learn how to monitor your Spring Cloud Data Flow Streams using Prometheus and Grafana.
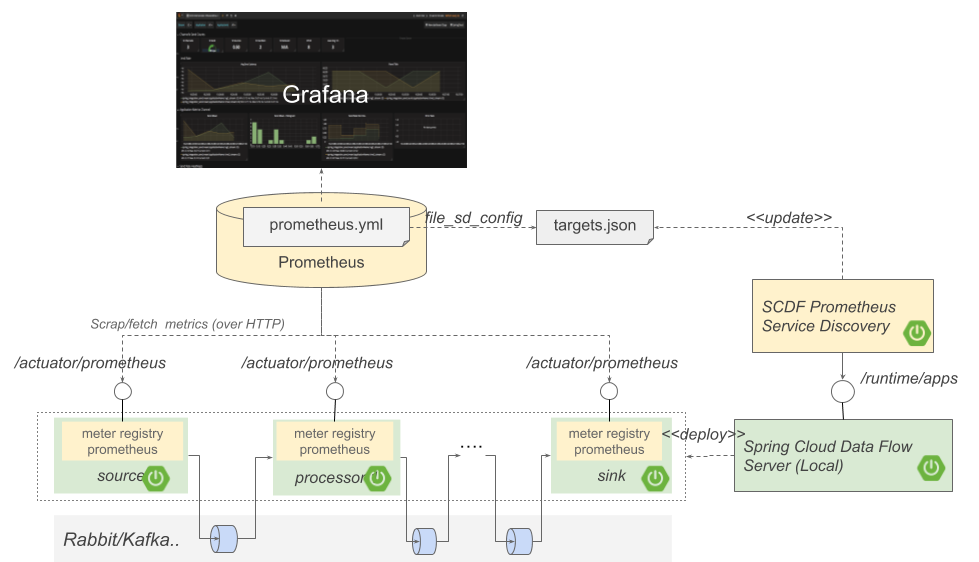
Starting with 2.0, Data Flow provides built-in support for monitoring with Prometheus. Following the reference manual instructions for how to get started with Prometheus:
Following diagram (Fig.4) illustrates the metrics collection flows for monitoring with prometheus on a Local SCDF platform:
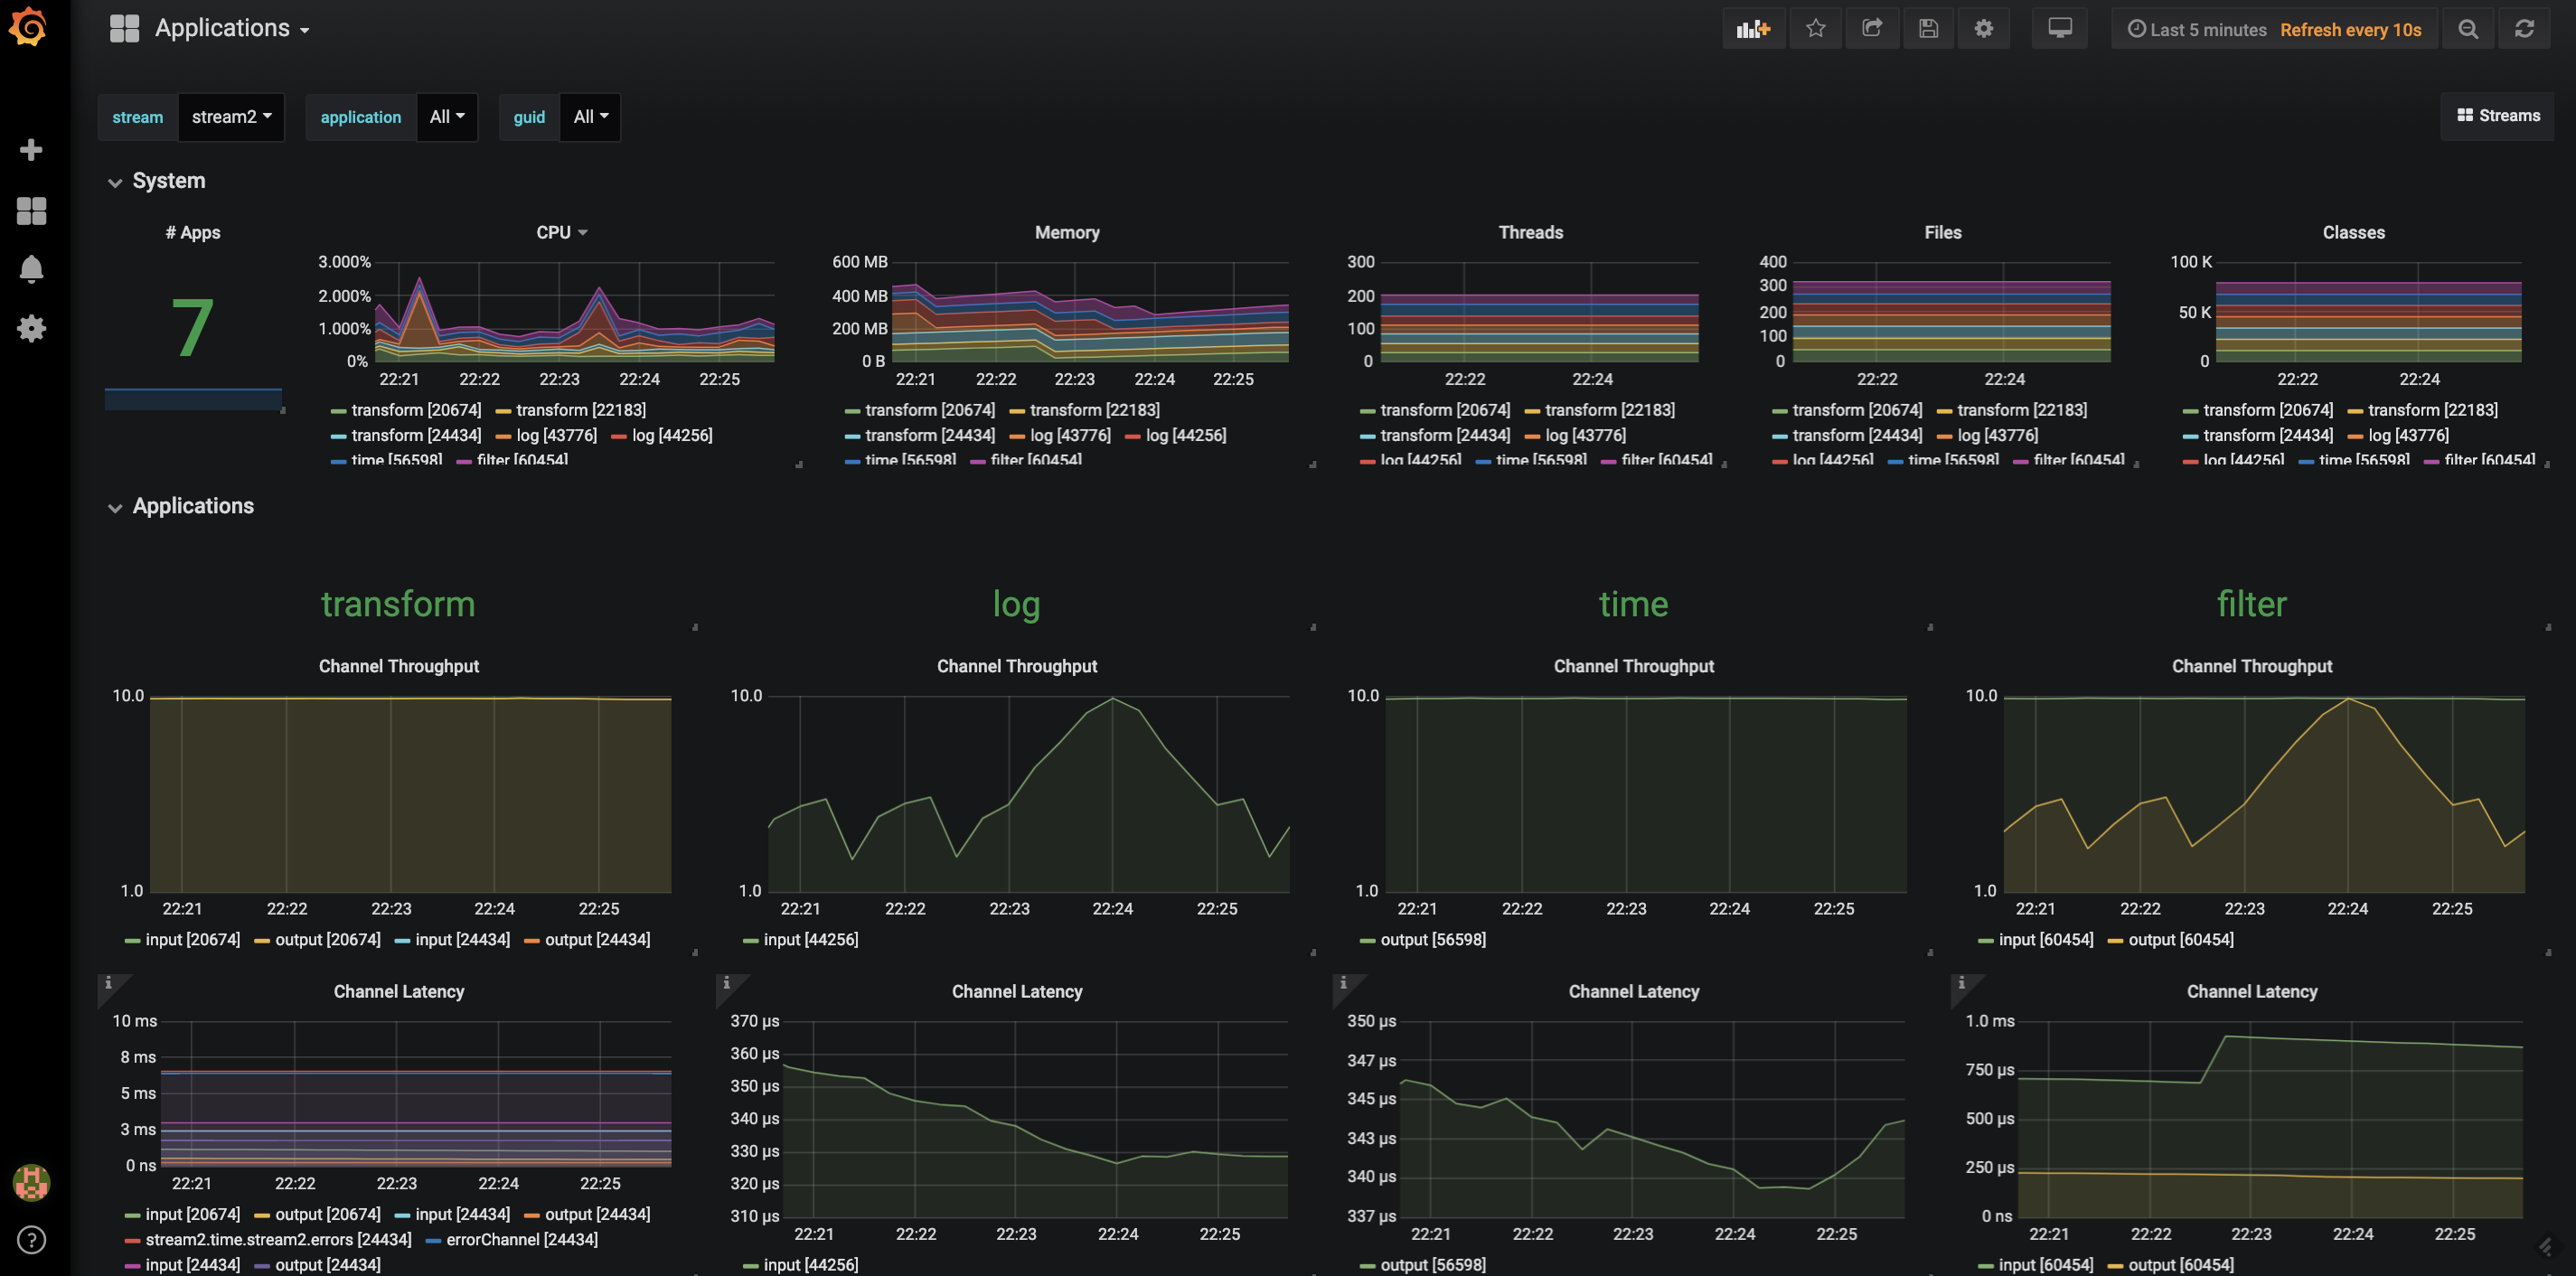
Out of the box, SCSt sends core metrics such as CPU, Memory, MVC and Health to name some. Among those the Spring Integration metrics allows computing the Rate and the Latency of the messages in the SCDF streams.
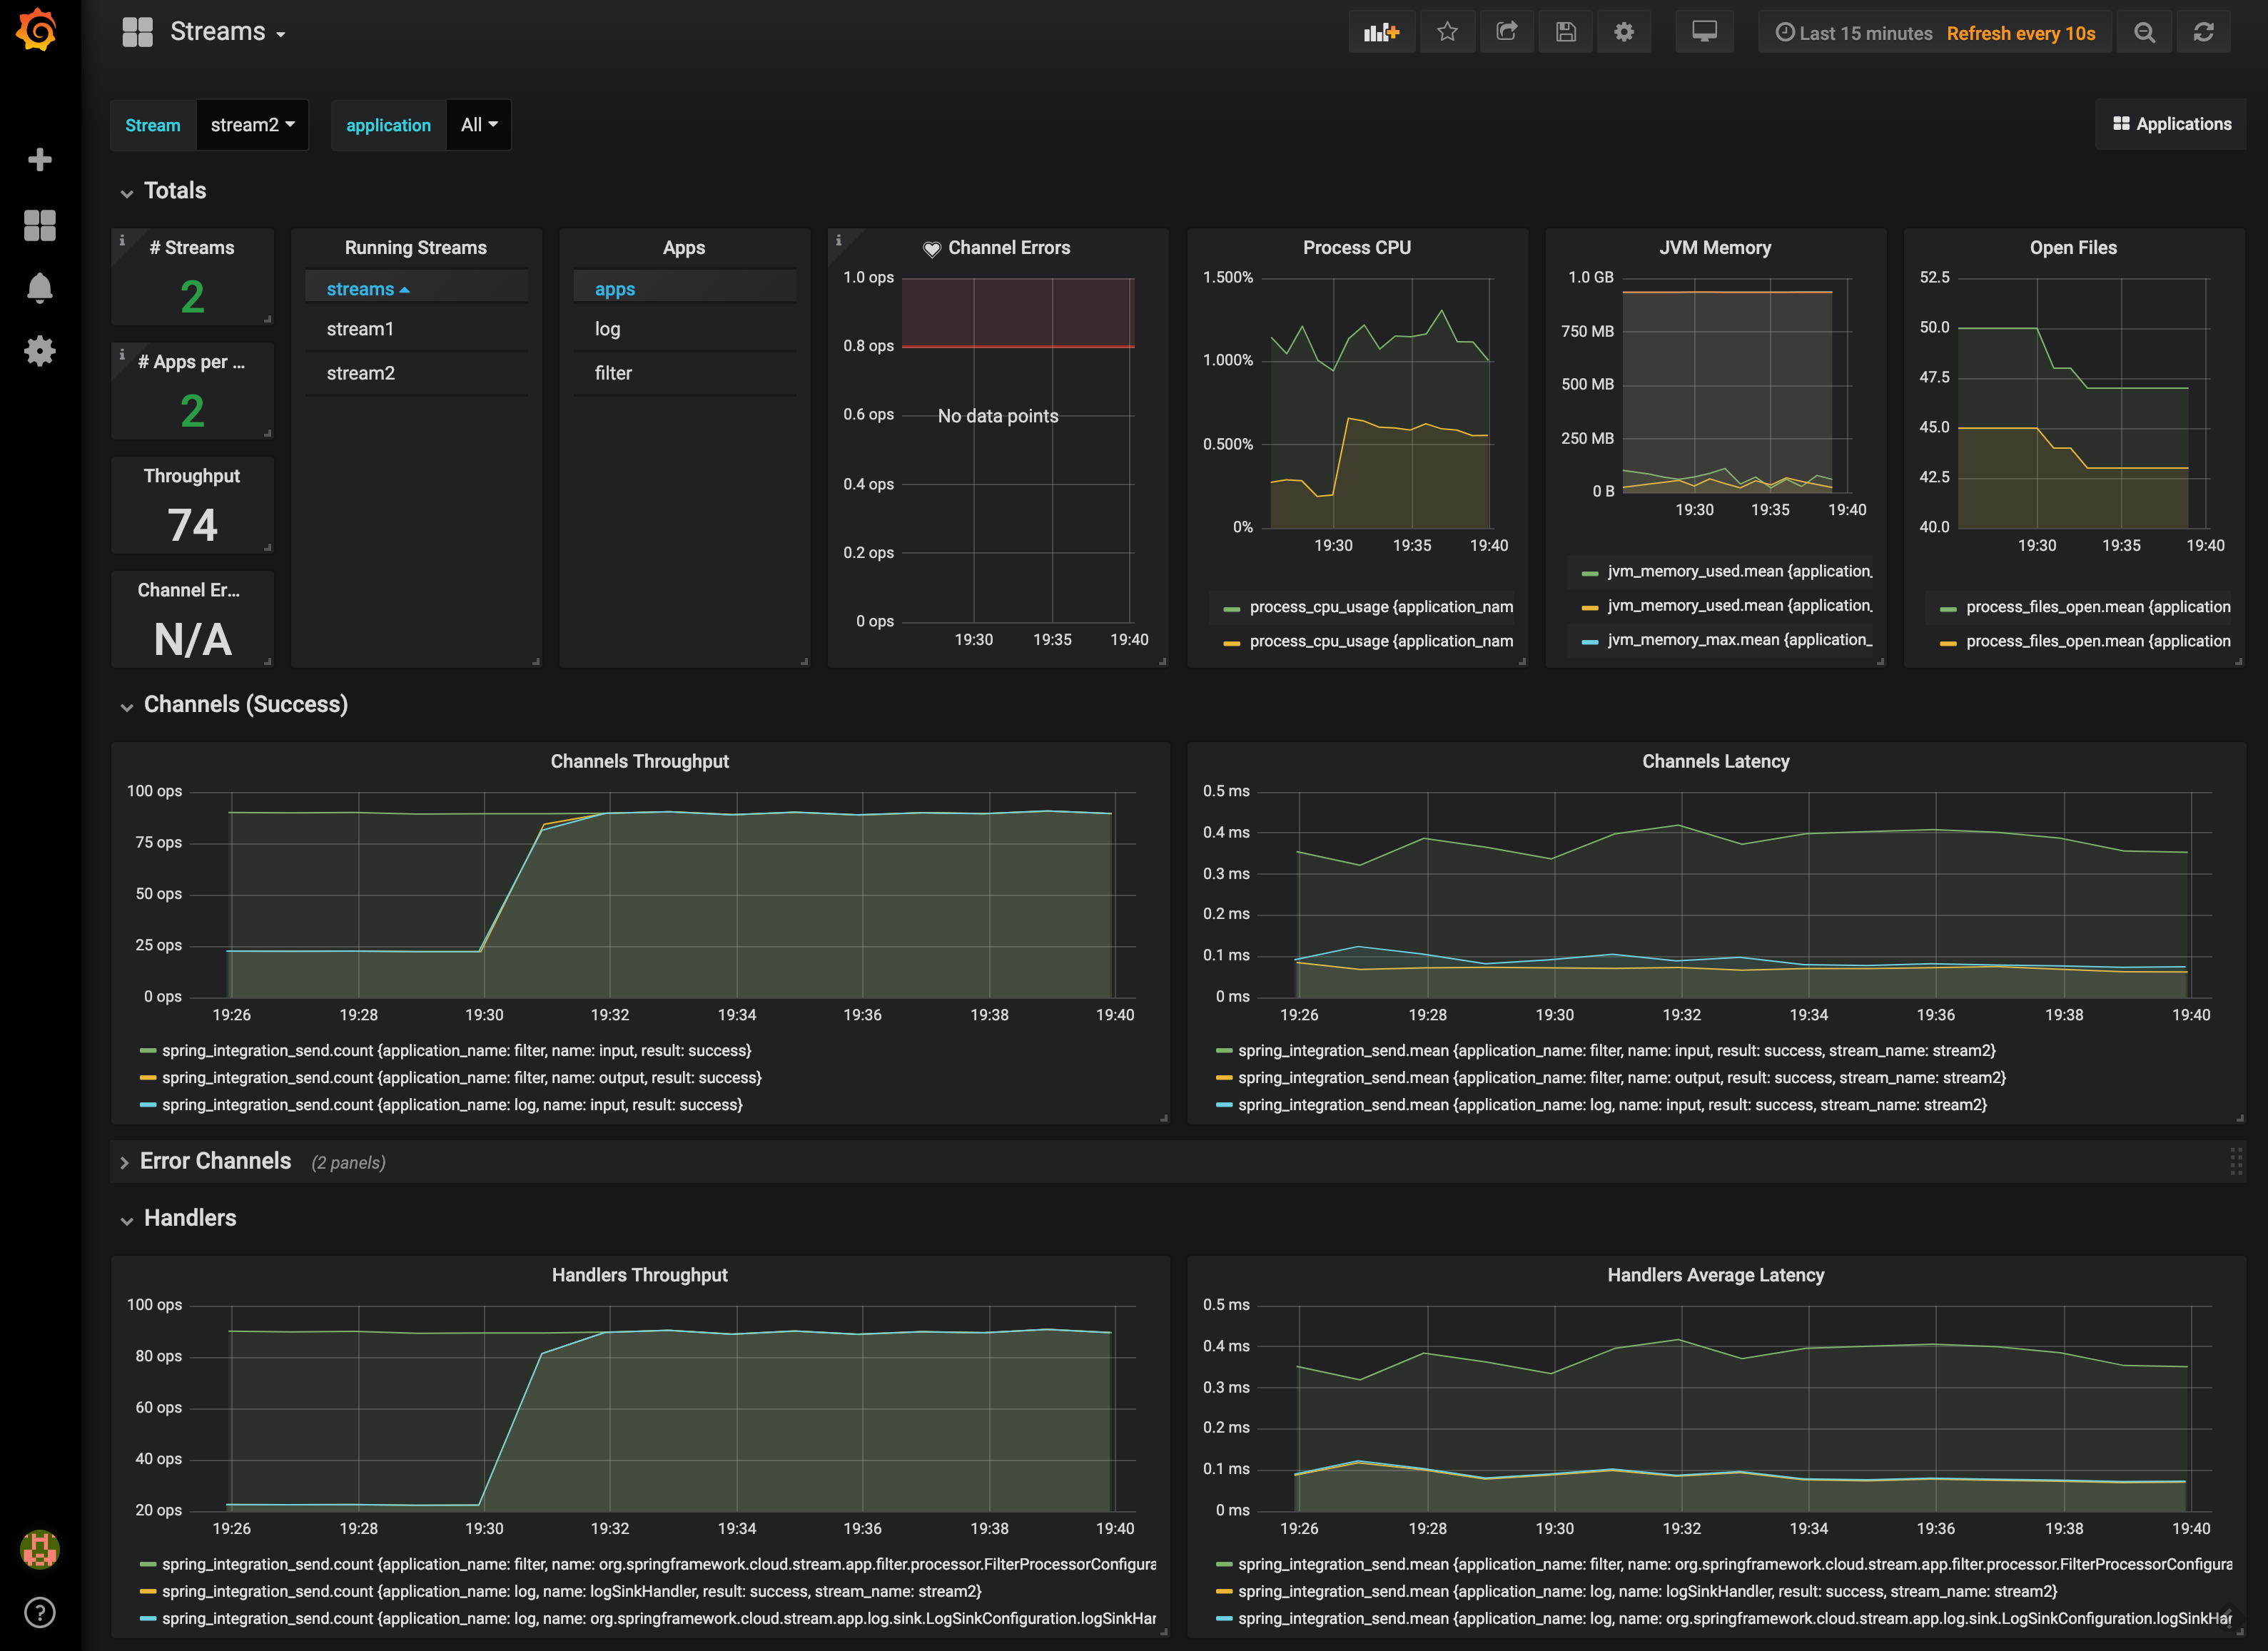
Once you deploy the stream you should see dashboards similar to these.