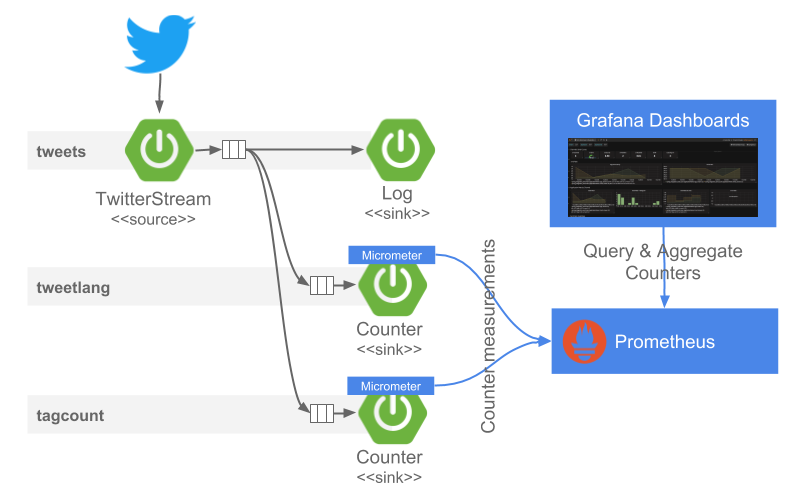
In this demonstration, you will learn how to build a data pipeline using Spring Cloud Data Flow to consume data from TwitterStream, compute analytics over data-in-transit using Analytics-Counter. Use Prometheus for storing and data aggregation analysis and Grafana for visualizing the computed data.
We will take you through the steps to configure Spring Cloud Data Flow’s Local server.
A running Local Data Flow Server with enabled Prometheus and Grafana monitoring.
On Linux/Mac, installation instructions would look like this:
$ wget https://raw.githubusercontent.com/spring-cloud/spring-cloud-dataflow/v2.8.1/src/docker-compose/docker-compose-prometheus.yml
$ wget https://raw.githubusercontent.com/spring-cloud/spring-cloud-dataflow/v2.8.1/src/docker-compose/docker-compose.yml

$ export STREAM_APPS_URI=https://dataflow.spring.io/kafka-maven-einstein

$ docker-compose -f ./docker-compose.yml -f ./docker-compose-prometheus.yml up
![[Note]](images/note.png)
Note This sample requires the 2.x (e.g. Einstein) pre-build applications! Depending on the platform (local, k8s or CF) and the binder (RabbitMQ or Kafka) one can install (or set via the
STREAM_APPS_URIvariable for local installations) apps from the following pre-build lists: (1) Kafka:dataflow.spring.io/kafka-docker-einstein,dataflow.spring.io/kafka-maven-einstein, (2) RabbitMQ:dataflow.spring.io/rabbitmq-docker-einstein,dataflow.spring.io/rabbitmq-maven-einstein.A running Data Flow Shell
$ wget https://repo.spring.io/release/org/springframework/cloud/spring-cloud-dataflow-shell/2.8.1/spring-cloud-dataflow-shell-2.8.1.jar
$ java -jar spring-cloud-dataflow-shell-2.8.1.jar

Welcome to the Spring Cloud Data Flow shell. For assistance hit TAB or type "help".
dataflow:>
The Shell connects to the Data Flow Server’s REST API and supports a DSL for stream or task lifecycle managing.
If you prefer, you can use the Data Flow UI: localhost:9393/dashboard, (or wherever it the server is hosted) to perform equivalent operations.
- Twitter credentials from Twitter Developers site
Create and deploy the following streams
The
tweetsstream subscribes to the provided twitter account, reads the incoming JSON tweets and logs their content to the log.dataflow:>stream create tweets --definition "twitterstream --consumerKey=<CONSUMER_KEY> --consumerSecret=<CONSUMER_SECRET> --accessToken=<ACCESS_TOKEN> --accessTokenSecret=<ACCESS_TOKEN_SECRET> | log"
Note To get a consumerKey and consumerSecret you need to register a twitter application. If you don’t already have one set up, you can create an app at the Twitter Developers site to get these credentials. The tokens
<CONSUMER_KEY>,<CONSUMER_SECRET>,<ACCESS_TOKEN>, and<ACCESS_TOKEN_SECRET>are required to be replaced with your account credentials.The received tweet messages would have a JSON format similar to this:
{ "created_at": "Thu Apr 06 15:24:15 +0000 2017", "id_str": "850006245121695744", "text": "Today we are sharing our vision for the future of the Twitter API platform!", "user": { "id":
The JsonPath SpEL expressions can help to extract the attributes to be analysed. For example the
#jsonPath(payload,'$..lang')expression extracts all values of thelangattributes in the tweet. The Analytics Counter Sink maps the extracted values to custom Micrometer tags/dimensions attached to every measurement send. Thetweetlangstream created below, extracts and counts the languages found in the tweets. The counter, namedlanguage, applies the--counter.tag.expression.lang=#jsonPath(payload,'$..lang')to extract the language values and map them to a Micrometer tag named:lang. This counter generates thelanguage_totaltime-series send to Prometheus.dataflow:>stream create tweetlang --definition ":tweets.twitterstream > counter --counter.name=language --counter.tag.expression.lang=#jsonPath(payload,'$..lang')" --deploy
Similarly, we can use the
#jsonPath(payload,'$.entities.hashtags[*].text')expression to extract and count the hastags in the incoming tweets. The following stream uses the counter-sink to compute real-time counts (named ashashtags) and thehtagattribute incounter.tag.expression.htagindicate to Micrometer in what tag to hold the extracted hashtag values from the incoming tweets.dataflow:>stream create tagcount --definition ":tweets.twitterstream > counter --counter.name=hashtags --counter.tag.expression.htag=#jsonPath(payload,'$.entities.hashtags[*].text')" --deploy
Now we can deploy the
tweetsstream to start tweet analysis.dataflow:>stream deploy tweets
Verify the streams are successfully deployed. Where: (1) is the primary pipeline; (2) and (3) are tapping the primary pipeline with the DSL syntax
<stream-name>.<label/app name>[e.x.:tweets.twitterstream]; and (4) is the final deployment of primary pipelinedataflow:>stream list
- Notice that
tweetlang.counter,tagcount.counter,tweets.logandtweets.twitterstreamSpring Cloud Stream applications are running as Spring Boot applications within thelocal-server. - Go to
Grafana Dashboardaccessible atlocalhost:3000, login asadmin:`admin`. Import the grafana-twitter-scdf-analytics.json dashboard.
![[Tip]](images/tip.png) | Tip |
|---|---|
you can import it directly using the following dashboard code: |
You will see a dashboard similar to this:
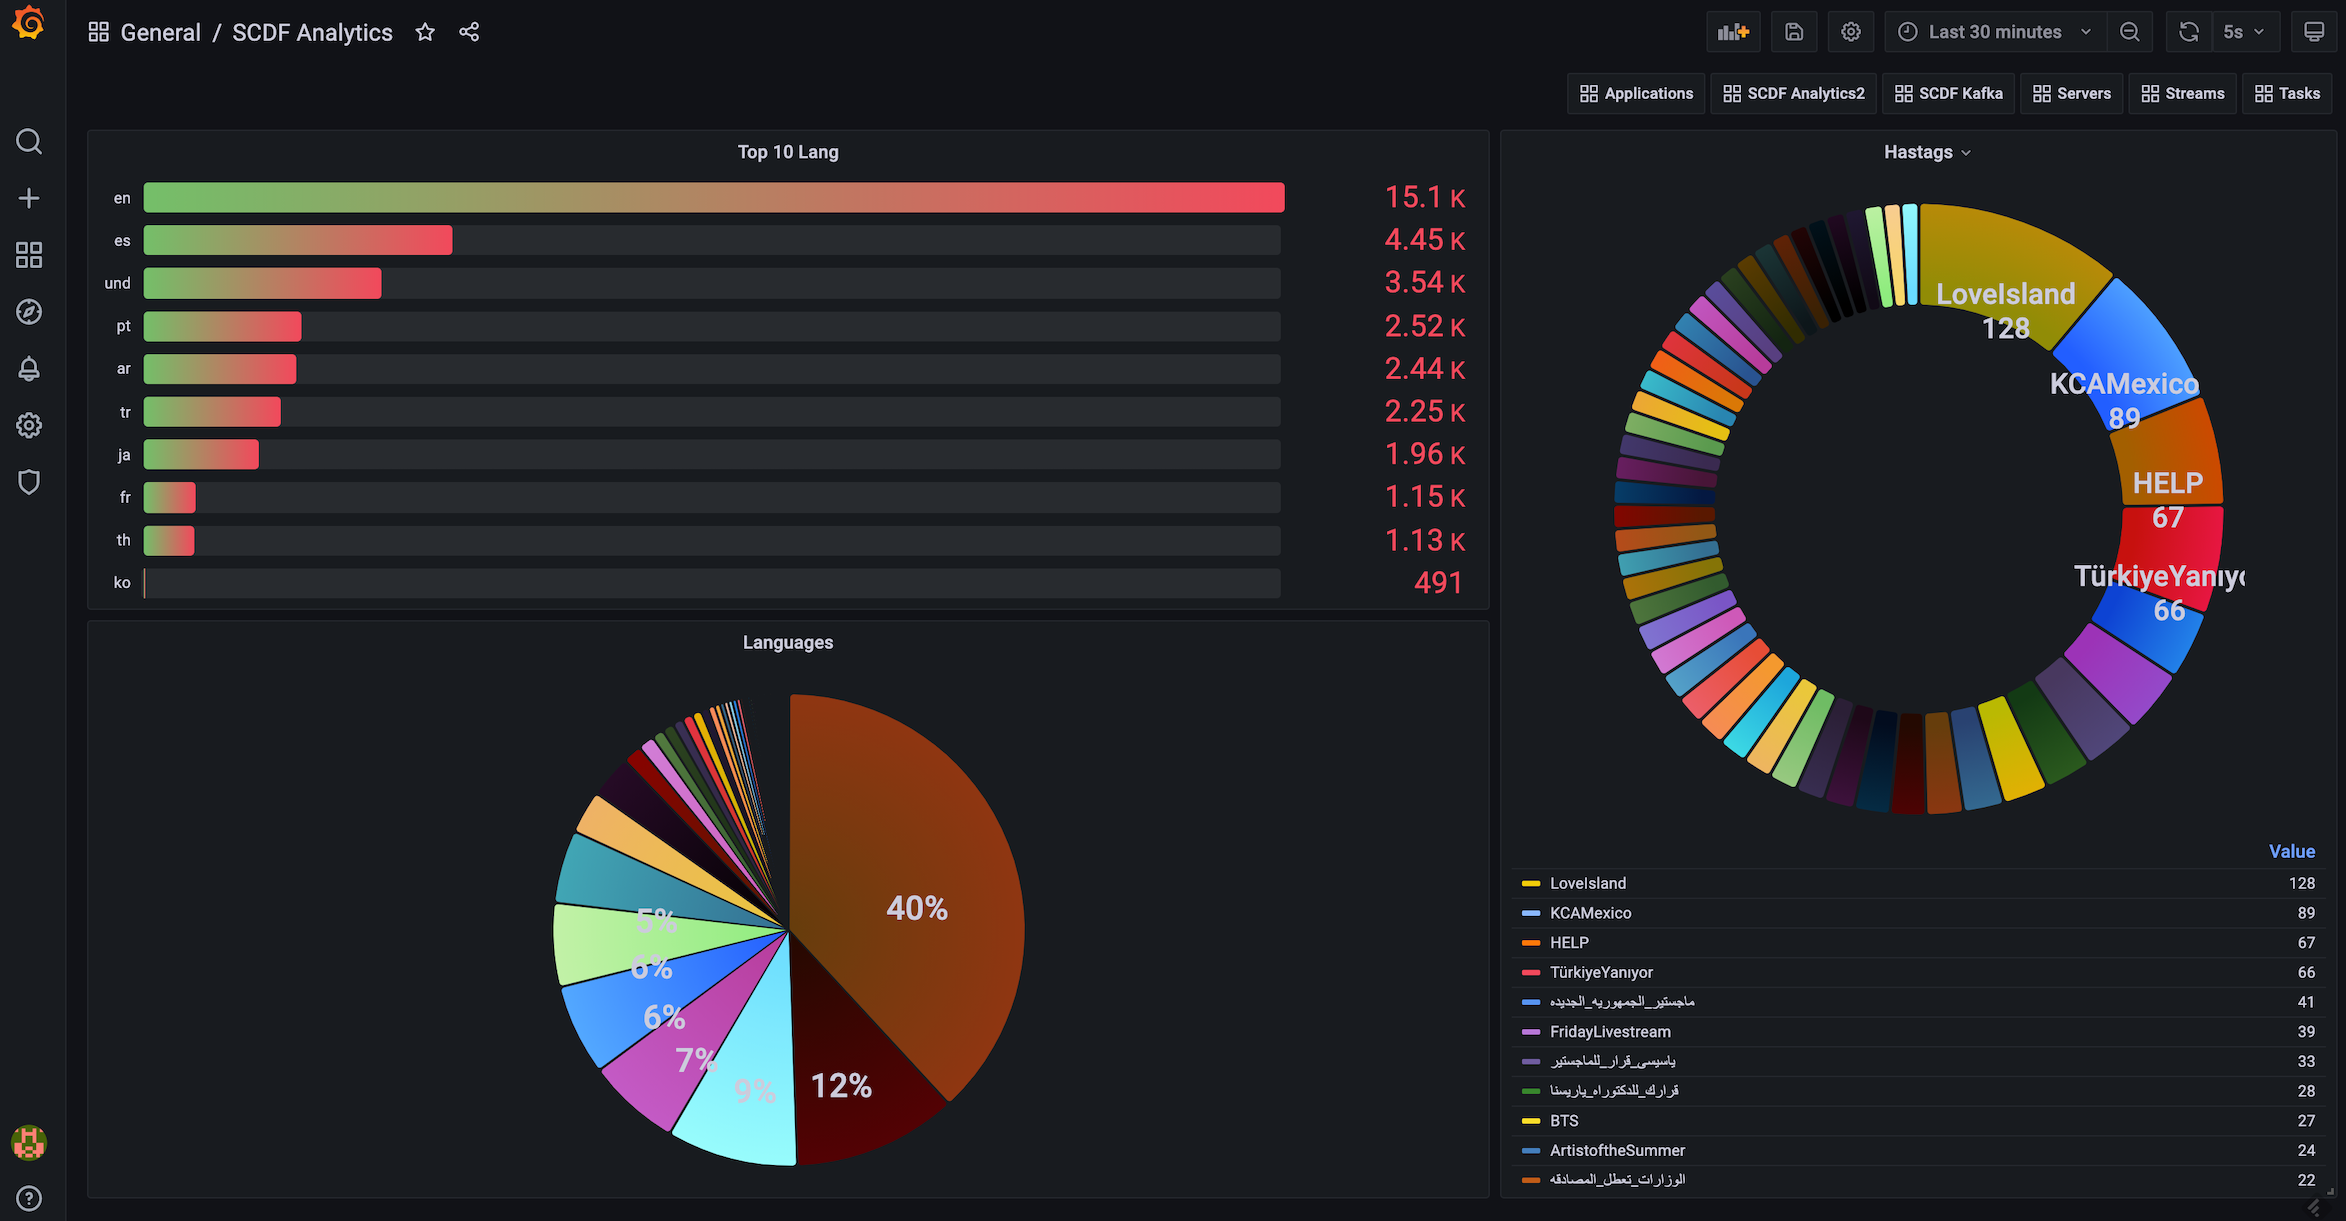
The following Prometheus queries have been used to aggregate the lang and htag data persisted in Prometheus, which can be visualized through Grafana dashboard:
sort_desc(topk(10, sum(language_total) by (lang)))
sort_desc(topk(100, sum(hashtags_total) by (htag)))
In this sample, you have learned:
- How to use Spring Cloud Data Flow’s
Localserver - How to use Spring Cloud Data Flow’s
shellapplication - How to use Prometheus and Grafana with Spring Cloud Data Flow’s
Localserver - How to create streaming data pipeline to compute simple analytics using
Twitter StreamandAnalytics Counterapplications