The Spring Cloud Data Flow server is a Spring Boot application that includes the Actuator library, which adds several production ready features to help you monitor and manage your application.
The Actuator library adds http endpoints under the context path /management that is also
a discovery page for available endpoints. For example, there is a health endpoint
that shows application health information and an env that lists properties from
Spring’s ConfigurableEnvironment. By default only the health and application info
endpoints are accessible. The other endpoints are considered to be sensitive
and need to be enabled explicitly via configuration. If you are enabling
sensitive endpoints then you should also
secure the Data Flow server’s endpoints so that
information is not inadvertently exposed to unauthenticated users. The local Data Flow server has security disabled by default, so all actuator endpoints are available.
The Data Flow server requires a relational database and if the feature toggled for
analytics is enabled, a Redis server is also required. The Data Flow server will
autoconfigure the DataSourceHealthIndicator and RedisHealthIndicator if needed. The health of these two services is incorporated to the overall health status of the server through the health endpoint.
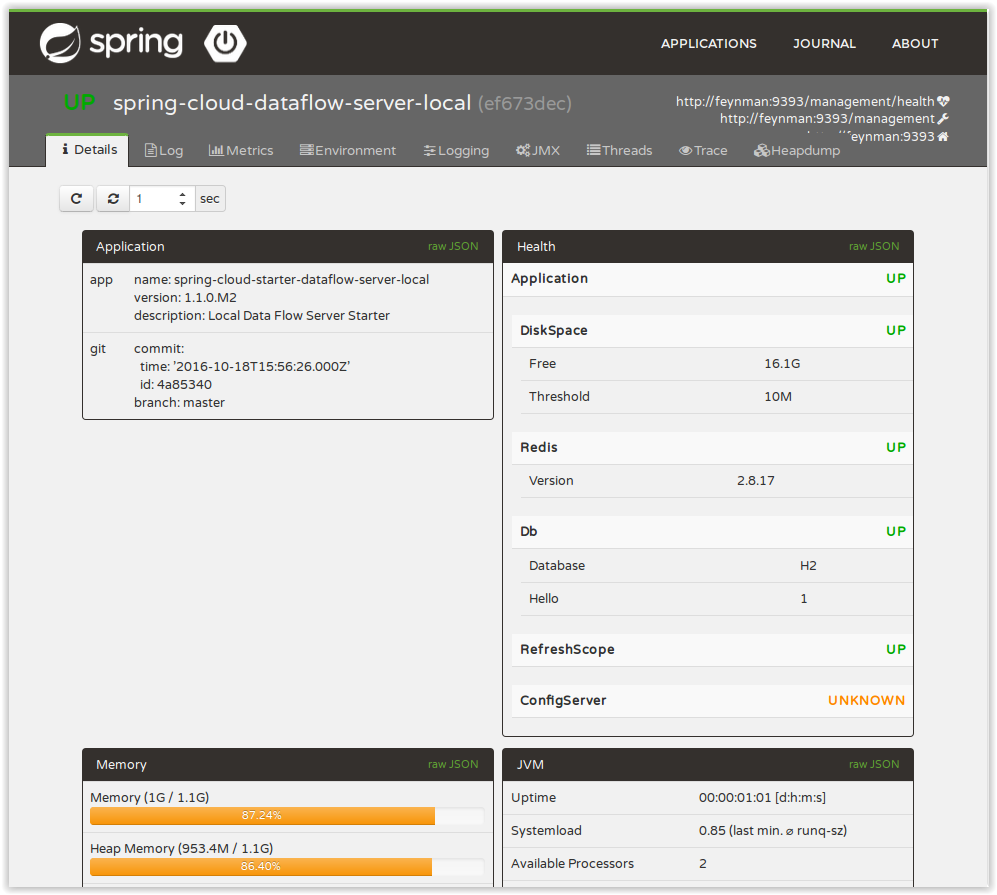
A nice way to visualize and interact with actuator endpoints is to incorporate the Spring Boot Admin client library into the Spring Cloud Data Flow server. You can create the Spring Boot Admin application by following a few simple steps.
A simple way to have the Spring Cloud Data Flow server be a client to the Spring Boot Admin Server is by adding a dependency to the Data Flow server’s Maven pom.xml file and an additional configuration property as documented in Registering Client Applications. You will need to clone the github repository for the Spring Cloud Data Flow server in order to modify the Maven pom. There are tags in the repository for each release.
Adding this dependency will result in a UI with tabs for each of the actuator endpoints.
Additional configuration is required to interact with JMX beans and logging levels. Refer
to the Spring Boot admin documentation for more information. As only the info
and health endpoints are available to unauthenticated users, you should enable security on
the Data Flow Server and also configure Spring Boot Admin server’s security so that it
can securely access the actuator endpoints.
The applications that are deployed by Spring Cloud Data Flow are based on Spring Boot which contains several features for monitoring your application in production. Each deployed application contains several web endpoints for monitoring and interacting with Stream and Task applications.
In particular, the /metrics endpoint contains counters
and gauges for HTTP requests, System Metrics (such as JVM stats), DataSource Metrics and Message Channel Metrics (such as message rates).
Spring Boot lets you add your own metrics to the /metrics endpoint either by registering an implementation of the PublicMetrics interface or through it’s integration with Dropwizard.
The Spring Boot interfaces MetricWriter and Exporter are used to send the
metrics data to a place where they can be displayed and analyzed. There are
implementations in Spring Boot to export metrics to Redis, Open TSDB, Statsd,
and JMX.
There are a few additional Spring projects that provide support for sending metrics data to external systems.
- Spring Cloud Stream provides
ApplicationMetricsExporterwhich publishes metrics via an Emitter to a messaging middleware destination. - Spring Cloud Data Flow Metrics Collector subscribes to the metrics destination and aggregates metric messages published by the Spring Cloud Stream applications. It has an HTTP endpoint to access the aggregated metrics.
- Spring Cloud Data Flow Metrics provides
LogMetricWriterthat writes to the log. - Spring Cloud Data Flow Metrics Datadog Metrics provides
DatadogMetricWriterthat writes to Datadog.
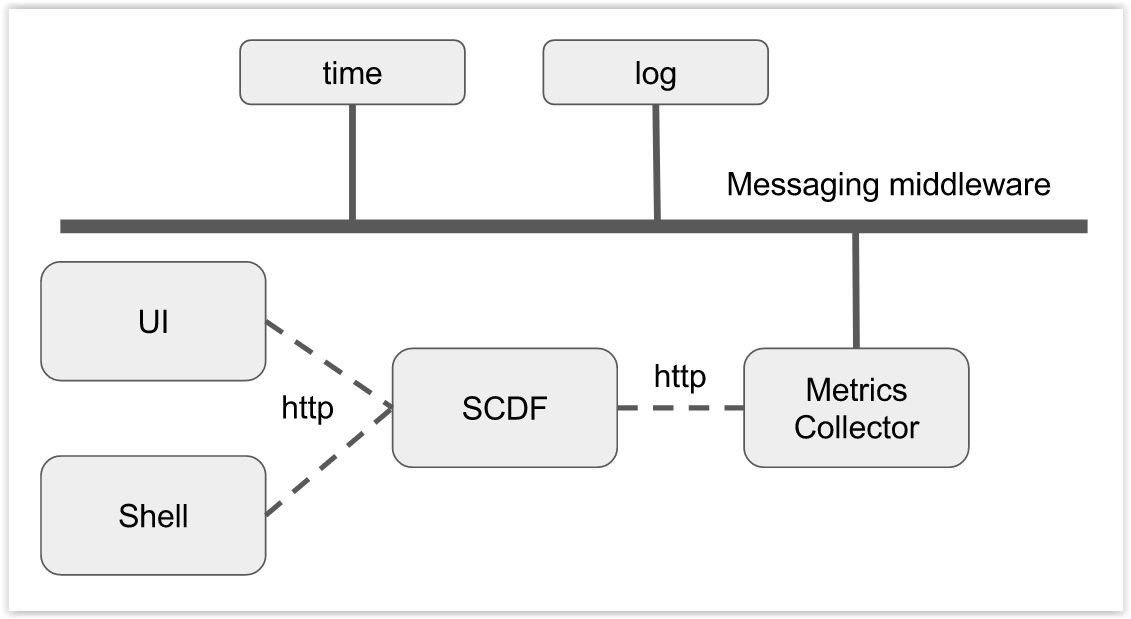
The Spring Cloud Stream Emitter is used by the Spring Cloud Stream App Starters project that provides the most commonly used applications when creating Data Flow Streams.
The architecture when using Spring Cloud Stream’s Emitter, the
Data Flow Metrics Collector, and the Data Flow server is shown below.
As with the App Starters, there is a Spring Boot uber jar artifact of the Metrics Collector for all of the supported binders. You can find more information on building and running the Metrics Collector on its project page.
The dataflow server now accepts an optional property spring.cloud.dataflow.metrics.collector.uri, this property should point to the URI of your deployed
metrics collector app. For example, if you are running the metrics collector locally on port 8080 then start the server (local example) with the following command:
$ java -jar spring-cloud-dataflow-server-local-1.2.1.BUILD-SNAPSHOT.jar --spring.cloud.dataflow.metrics.collector.uri=http://localhost:8080
The Metrics Collector can be secured with 'basic' authentication that requires a username and password. To set the username and password, use the properties spring.cloud.dataflow.metrics.collector.username and spring.cloud.dataflow.metrics.collector.password.
The metrics
for each application are published when the property spring.cloud.stream.bindings.applicationMetrics.destination is set. This can be set as any other
application property when deploying an application in Data Flow. Since
it is quite common to want all applications in a stream to emit metrics,
setting it at the Data Flow server level is a good way to achieve that.
spring.cloud.dataflow.applicationProperties.stream.spring.cloud.stream.bindings.applicationMetrics.destination=metrics
Using the destination name metrics is a good choice as the Metrics
Collector subscribes to that name by default.
The next most common way to configure the metrics destination is using
deployment properties. Here is an example for the ticktock stream that
uses the App Starters time and log applications.
app register --name time --type source --uri maven://org.springframework.cloud.stream.app:time-source-rabbit:1.2.0.RELEASE

app register --name log --type sink --uri maven://org.springframework.cloud.stream.app:log-sink-rabbit:1.2.0.RELEASE

stream create --name foostream --definition "time | log"

stream deploy --name foostream --properties "app.*.spring.cloud.stream.bindings.applicationMetrics.destination=metrics,deployer.*.count=2"
The Metrics Collector exposes aggregated metrics under the HTTP endpoint
/collector/metrics in JSON format. The Data Flow server accesses this
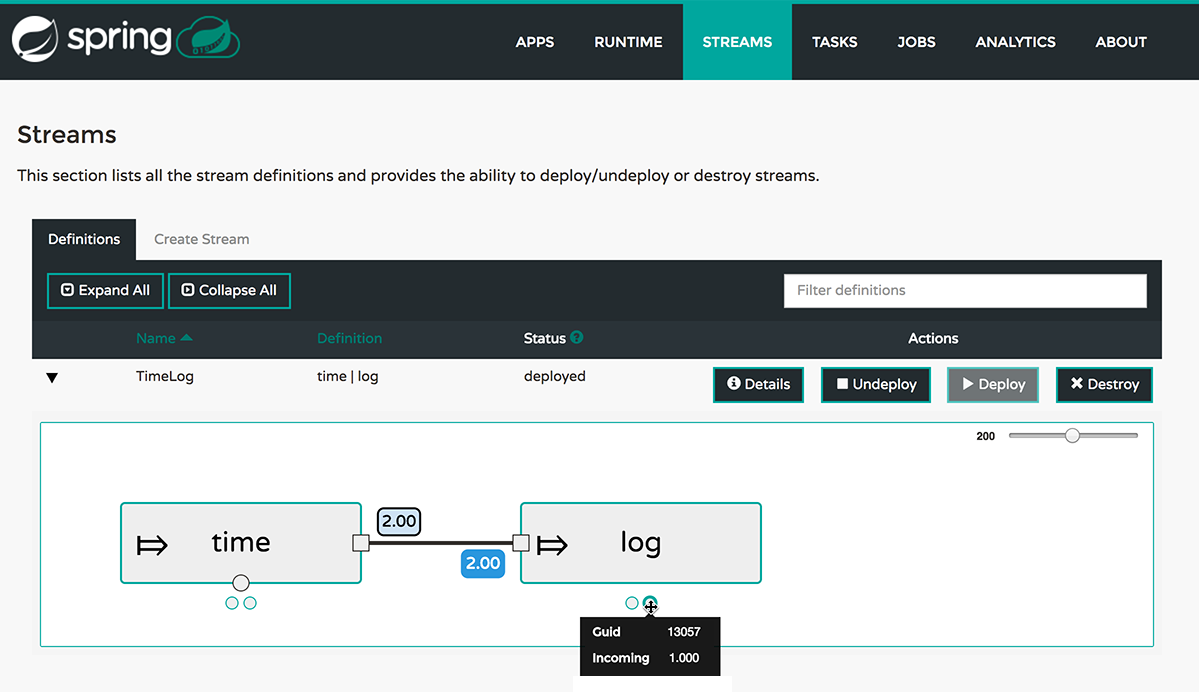
endpoint in two distinct ways. The first is by exposing a /metrics/streams
HTTP endpoint that acts as a proxy to the Metrics Collector endpoint. This
is accessed by the UI when overlaying message rates on the Flo diagrams for
each stream. It is also accessed to enrich the Data Flow /runtime/apps
endpoint that is exposed in the UI via the Runtime tab and in the shell
through the runtime apps command with message rates.
By default, Data Flow will set the property
spring.cloud.stream.metrics.properties=spring.application.name,spring.application.index,spring.cloud.application.*,spring.cloud.dataflow.*
Which is the set of application properties values needed to perform aggregation. It will also set the property
spring.metrics.export.triggers.application.includes=integration**`since Data Flow will only display instantaneous input and output channel
message rates. By default, all metric values in the /metric endpoint
are sent so restricting it reduces the size of the message payload without
impacting the functionality. Data Flow also exposes a guid property when
displaying metric data which is used track back to the specific application
instance that generated the metric. The guid value is platform dependent.
Note that you can override these defaults by setting then as you would any application property value.
Data Flow will not provide it’s own implementation to store and visualize historical metrics data. We will integrate with existing ALM system by providing an Exporter application that consumes messages from the same destination as the Metrics Collector and writes them to an existing ALM system. Which specific ALM system we will support is driven by user demand. However, to serve as an example, we will develop an Elastic Search exporter with a Grafana front end since it is open source.
If you prefer to have deployed applications bypass the centralized collection of metrics via the Metrics Collector, you can use the MetricWriters in Spring Cloud Data Flow Metrics and Spring Cloud Data Flow Metrics Datadog Metrics.
The Data Flow Metrics project provides the foundation for exporting Spring Boot
metrics via MetricWriters. It provides Spring Boots AutoConfiguration to setup
the writing process and common functionality such as defining a metric name
prefix appropriate for your environement. For example, you may want to
includes the region where the application is running in addition to the
application’s name and stream/task to which it belongs. It also includes a
LogMetricWriter so that metrics can be stored into the log file. While very
simple in approach, log files are often ingested into application monitoring
tools (such as Splunk) where they can be further processed to create dashboards
of an application’s performance.
To make use of this functionality, you will need to add additional dependencies into your Stream and Task applications. To customize the "out of the box" Task and Stream applications you can use the Data Flow Initializr to generate a project and then add to the generated Maven pom file the MetricWriter implementation you want to use. The documentation on the Data Flow Metrics project pages provides the additional information you need to get started.