This section dives into the details of Spring Cloud Sleuth. Here you can learn about the key features that you may want to use and customize. If you have not already done so, you might want to read the "getting-started.html" and "using.html" sections, so that you have a good grounding in the basics.
1. Context Propagation
Traces connect from service to service using header propagation. The default format is B3. Similar to data formats, you can configure alternate header formats also, provided trace and span IDs are compatible with B3. Most notably, this means the trace ID and span IDs are lower-case hex, not UUIDs. Besides trace identifiers, other properties (Baggage) can also be passed along with the request. Remote Baggage must be predefined, but is flexible otherwise.
To use the provided defaults you can set the spring.sleuth.propagation.type property.
The value can be a list in which case you will propagate more tracing headers.
For Brave we support AWS, B3, W3C propagation types.
You can read more about how to provide custom context propagation in this "how to section".
2. Sampling
Spring Cloud Sleuth pushes the sampling decision down to the tracer implementation. However, there are cases where you can change the sampling decision at runtime.
One of such cases is skip reporting of certain client spans.
To achieve that you can set the spring.sleuth.web.client.skip-pattern with the path patterns to be skipped.
Another option is to provide your own custom org.springframework.cloud.sleuth.SamplerFunction<`org.springframework.cloud.sleuth.http.HttpRequest> implementation and define when a given HttpRequest should not be sampled.
3. Baggage
Distributed tracing works by propagating fields inside and across services that connect the trace together: traceId and spanId notably. The context that holds these fields can optionally push other fields that need to be consistent regardless of many services are touched. The simple name for these extra fields is "Baggage".
Sleuth allows you to define which baggage are permitted to exist in the trace context, including what header names are used.
The following example shows setting baggage values using Spring Cloud Sleuth’s API:
try (Tracer.SpanInScope ws = this.tracer.withSpan(initialSpan)) {
    BaggageInScope businessProcess = this.tracer.createBaggage(BUSINESS_PROCESS).set("ALM");
    BaggageInScope countryCode = this.tracer.createBaggage(COUNTRY_CODE).set("FO");
try {| There is currently no limitation of the count or size of baggage items. Keep in mind that too many can decrease system throughput or increase RPC latency. In extreme cases, too much baggage can crash the application, due to exceeding transport-level message or header capacity. |
You can use properties to define fields that have no special configuration such as name mapping:
-
spring.sleuth.baggage.remote-fieldsis a list of header names to accept and propagate to remote services. -
spring.sleuth.baggage.local-fieldsis a list of names to propagate locally
No prefixing applies with these keys. What you set is literally what is used.
A name set in either of these properties will result in a Baggage of the same name.
In order to automatically set the baggage values to Slf4j’s MDC, you have to set the spring.sleuth.baggage.correlation-fields property with a list of allowed local or remote keys. E.g. spring.sleuth.baggage.correlation-fields=country-code will set the value of the country-code baggage into MDC.
Note that the extra field is propagated and added to MDC starting with the next downstream trace context. To immediately add the extra field to MDC in the current trace context, configure the field to flush on update:
// configuration
@Bean
BaggageField countryCodeField() {
    return BaggageField.create("country-code");
}

@Bean
ScopeDecorator mdcScopeDecorator() {
    return MDCScopeDecorator.newBuilder()
            .clear()
            .add(SingleCorrelationField.newBuilder(countryCodeField())
                    .flushOnUpdate()
                    .build())
            .build();
}

// service
@Autowired
BaggageField countryCodeField;

countryCodeField.updateValue("new-value");| Remember that adding entries to MDC can drastically decrease the performance of your application! |
If you want to add the baggage entries as tags, to make it possible to search for spans via the baggage entries, you can set the value of
spring.sleuth.baggage.tag-fields with a list of allowed baggage keys.
To disable the feature you have to pass the spring.sleuth.propagation.tag.enabled=false property.
3.1. Baggage versus Tags
Like trace IDs, Baggage is attached to messages or requests, usually as headers. Tags are key value pairs sent in a Span to Zipkin. Baggage values are not added spans by default, which means you can’t search based on Baggage unless you opt-in.
To make baggage also tags, use the property spring.sleuth.baggage.tag-fields
like so:
spring:
  sleuth:
    baggage:
      foo: bar
      remoteFields:
        - country-code
        - x-vcap-request-id
      tagFields:
        - country-code
4. OpenZipkin Brave Tracer Integration
Spring Cloud Sleuth integrates with the OpenZipkin Brave tracer via the bridge that is available in the spring-cloud-sleuth-brave module.
In this section you can read about specific Brave integrations.
You can choose to use either Sleuth’s API or the Brave API directly in your code (e.g. either Sleuth’s Tracer or Brave’s Tracer).
If you want to use this tracer implementation’s API directly please read their documentation to learn more about it.
4.1. Brave Basics
Here are the most core types you might use:
-
brave.SpanCustomizer- to change the span currently in progress -
brave.Tracer- to get a start new spans ad-hoc
Here are the most relevant links from the OpenZipkin Brave project:
4.2. Brave Sampling
Sampling only applies to tracing backends, such as Zipkin. Trace IDs appear in logs regardless of sample rate. Sampling is a way to prevent overloading the system, by consistently tracing some, but not all requests.
The default rate of 10 traces per second is controlled by the spring.sleuth.sampler.rate
property and applies when we know Sleuth is used for reasons besides logging.
Use a rate above 100 traces per second with extreme caution as it can overload your tracing system.
The sampler can be set by Java Config also, as shown in the following example:
@Bean
public Sampler defaultSampler() {
    return Sampler.ALWAYS_SAMPLE;
}
You can set the HTTP header b3 to 1, or, when doing messaging, you can set the spanFlags header to 1.
Doing so forces the current request to be sampled regardless of configuration.
|
By default samplers will work with the refresh scope mechanism.
That means that you can change the sampling properties at runtime, refresh the application and the changes will be reflected.
However, sometimes the fact of creating a proxy around samplers and calling it from too early (from @PostConstruct annotated method) may lead to dead locks.
In such a case either create a sampler bean explicitly, or set the property spring.sleuth.sampler.refresh.enabled to false to disable the refresh scope support.
4.3. Brave Baggage Java configuration
If you need to do anything more advanced than above, do not define properties and instead use a
@Bean config for the baggage fields you use.
-
BaggagePropagationCustomizersets up baggage fields -
Add a
SingleBaggageFieldto control header names for aBaggage. -
CorrelationScopeCustomizersets up MDC fields -
Add a
SingleCorrelationFieldto change the MDC name of aBaggageor if updates flush.
4.4. Brave Customizations
The brave.Tracer object is fully managed by sleuth, so you rarely need to affect it.
That said, Sleuth supports a number of Customizer types, that allow you to configure anything not already done by Sleuth with auto-configuration or properties.
If you define one of the following as a Bean, Sleuth will invoke it to customize behaviour:
-
RpcTracingCustomizer- for RPC tagging and sampling policy -
HttpTracingCustomizer- for HTTP tagging and sampling policy -
MessagingTracingCustomizer- for messaging tagging and sampling policy -
CurrentTraceContextCustomizer- to integrate decorators such as correlation. -
BaggagePropagationCustomizer- for propagating baggage fields in process and over headers -
CorrelationScopeDecoratorCustomizer- for scope decorations such as MDC (logging) field correlation
4.4.1. Brave Sampling Customizations
If client /server sampling is required, just register a bean of type
brave.sampler.SamplerFunction<HttpRequest> and name the bean
sleuthHttpClientSampler for client sampler and sleuthHttpServerSampler
for server sampler.
For your convenience the @HttpClientSampler and @HttpServerSampler
annotations can be used to inject the proper beans or to reference the bean names via their static String NAME fields.
Check out Brave’s code to see an example of how to make a path-based sampler github.com/openzipkin/brave/tree/master/instrumentation/http#sampling-policy
If you want to completely rewrite the HttpTracing bean you can use the SkipPatternProvider
interface to retrieve the URL Pattern for spans that should be not sampled.
Below you can see an example of usage of SkipPatternProvider inside a server side, Sampler<HttpRequest>.
@Configuration(proxyBeanMethods = false)
    class Config {
  @Bean(name = HttpServerSampler.NAME)
  SamplerFunction<HttpRequest> myHttpSampler(SkipPatternProvider provider) {
      Pattern pattern = provider.skipPattern();
      return request -> {
          String url = request.path();
          boolean shouldSkip = pattern.matcher(url).matches();
          if (shouldSkip) {
              return false;
          }
          return null;
      };
  }
}
4.5. Brave Messaging
Sleuth automatically configures the MessagingTracing bean which serves as a foundation for Messaging instrumentation such as Kafka or JMS.
If a customization of producer / consumer sampling of messaging traces is required, just register a bean of type brave.sampler.SamplerFunction<MessagingRequest> and name the bean sleuthProducerSampler for producer sampler and sleuthConsumerSampler
for consumer sampler.
For your convenience the @ProducerSampler and @ConsumerSampler
annotations can be used to inject the proper beans or to reference the bean names via their static String NAME fields.
Ex.
Here’s a sampler that traces 100 consumer requests per second, except for the "alerts" channel.
Other requests will use a global rate provided by the
Tracing component.
@Configuration(proxyBeanMethods = false)
    class Config {
  @Bean(name = ConsumerSampler.NAME)
  SamplerFunction<MessagingRequest> myMessagingSampler() {
      return MessagingRuleSampler.newBuilder().putRule(channelNameEquals("alerts"), Sampler.NEVER_SAMPLE)
              .putRule(Matchers.alwaysMatch(), RateLimitingSampler.create(100)).build();
  }
}4.6. Brave Opentracing
You can integrate with Brave and OpenTracing via the
io.opentracing.brave:brave-opentracing bridge.
Just add it to the classpath and the OpenTracing Tracer will be set up automatically.
5. Sending Spans to Zipkin
Spring Cloud Sleuth provides various integrations with the OpenZipkin distributed tracing system.
Regardless of the chosen tracer implementation it’s enough to add spring-cloud-sleuth-zipkin to the classpath to start sending spans to Zipkin.
You can choose whether to do that via HTTP or messaging.
You can read more about how to do that in "how to section".
When the span is closed, it is sent to Zipkin over HTTP. The communication is asynchronous.
You can configure the URL by setting the spring.zipkin.baseUrl property, as follows:
spring.zipkin.baseUrl: https://192.168.99.100:9411/If you want to find Zipkin through service discovery, you can pass the Zipkin’s service ID inside the URL, as shown in the following example for zipkinserver service ID:
spring.zipkin.baseUrl: https://zipkinserver/To disable this feature just set spring.zipkin.discovery-client-enabled to false.
When the Discovery Client feature is enabled, Sleuth uses
LoadBalancerClient to find the URL of the Zipkin Server.
It means that you can set up the load balancing configuration.
If you have web, rabbit, activemq or kafka together on the classpath, you might need to pick the means by which you would like to send spans to zipkin.
To do so, set web, rabbit, activemq or kafka to the spring.zipkin.sender.type property.
The following example shows setting the sender type for web:
spring.zipkin.sender.type: webTo customize the RestTemplate that sends spans to Zipkin via HTTP, you can register the ZipkinRestTemplateCustomizer bean.
@Configuration(proxyBeanMethods = false)
    class MyConfig {
    @Bean ZipkinRestTemplateCustomizer myCustomizer() {
        return new ZipkinRestTemplateCustomizer() {
            @Override
            void customize(RestTemplate restTemplate) {
                // customize the RestTemplate
            }
        };
    }
}
If, however, you would like to control the full process of creating the RestTemplate
object, you will have to create a bean of zipkin2.reporter.Sender type.
@Bean Sender myRestTemplateSender(ZipkinProperties zipkin,
        ZipkinRestTemplateCustomizer zipkinRestTemplateCustomizer) {
    RestTemplate restTemplate = mySuperCustomRestTemplate();
    zipkinRestTemplateCustomizer.customize(restTemplate);
    return myCustomSender(zipkin, restTemplate);
}
By default, api path will be set to api/v2/spans or api/v1/spans depending on the encoder version. If you want to use a custom api path, you can configure it using the following property (empty case, set ""):
spring.zipkin.api-path: v2/path25.1. Custom service name
By default, Sleuth assumes that, when you send a span to Zipkin, you want the span’s service name to be equal to the value of the spring.application.name property.
That is not always the case, though.
There are situations in which you want to explicitly provide a different service name for all spans coming from your application.
To achieve that, you can pass the following property to your application to override that value (the example is for a service named myService):
spring.zipkin.service.name: myService5.2. Host Locator
| This section is about defining host from service discovery. It is NOT about finding Zipkin through service discovery. |
To define the host that corresponds to a particular span, we need to resolve the host name and port. The default approach is to take these values from server properties. If those are not set, we try to retrieve the host name from the network interfaces.
If you have the discovery client enabled and prefer to retrieve the host address from the registered instance in a service registry, you have to set the spring.zipkin.locator.discovery.enabled property (it is applicable for both HTTP-based and Stream-based span reporting), as follows:
spring.zipkin.locator.discovery.enabled: true5.3. Customization of Reported Spans
In Sleuth, we generate spans with a fixed name. Some users want to modify the name depending on values of tags.
Sleuth registers a SpanFilter bean that can automatically skip reporting spans of given name patterns.
The property spring.sleuth.span-filter.span-name-patterns-to-skip contains the default skip patterns for span names.
The property spring.sleuth.span-filter.additional-span-name-patterns-to-skip will append the provided span name patterns to the existing ones.
In order to disable this functionality just set spring.sleuth.span-filter.enabled to false.
5.3.1. Brave Customization of Reported Spans
| This section is applicable for Brave tracer only. |
Before reporting spans (for example, to Zipkin) you may want to modify that span in some way.
You can do so by implementing a SpanHandler.
The following example shows how to register two beans that implement SpanHandler:
@Bean
SpanHandler handlerOne() {
    return new SpanHandler() {
        @Override
        public boolean end(TraceContext traceContext, MutableSpan span, Cause cause) {
            span.name("foo");
            return true; // keep this span
        }
    };
}

@Bean
SpanHandler handlerTwo() {
    return new SpanHandler() {
        @Override
        public boolean end(TraceContext traceContext, MutableSpan span, Cause cause) {
            span.name(span.name() + " bar");
            return true; // keep this span
        }
    };
}
The preceding example results in changing the name of the reported span to foo bar, just before it gets reported (for example, to Zipkin).
5.4. Overriding the auto-configuration of Zipkin
Spring Cloud Sleuth supports sending traces to multiple tracing systems as of version 2.1.0. In order to get this to work, every tracing system needs to have a Reporter<Span> and Sender.
If you want to override the provided beans you need to give them a specific name.
To do this you can use respectively ZipkinAutoConfiguration.REPORTER_BEAN_NAME and ZipkinAutoConfiguration.SENDER_BEAN_NAME.
@Configuration(proxyBeanMethods = false)
protected static class MyConfig {

    @Bean(ZipkinAutoConfiguration.REPORTER_BEAN_NAME)
    Reporter<zipkin2.Span> myReporter(@Qualifier(ZipkinAutoConfiguration.SENDER_BEAN_NAME) MySender mySender) {
        return AsyncReporter.create(mySender);
    }

    @Bean(ZipkinAutoConfiguration.SENDER_BEAN_NAME)
    MySender mySender() {
        return new MySender();
    }

    static class MySender extends Sender {

        private boolean spanSent = false;

        boolean isSpanSent() {
            return this.spanSent;
        }

        @Override
        public Encoding encoding() {
            return Encoding.JSON;
        }

        @Override
        public int messageMaxBytes() {
            return Integer.MAX_VALUE;
        }

        @Override
        public int messageSizeInBytes(List<byte[]> encodedSpans) {
            return encoding().listSizeInBytes(encodedSpans);
        }

        @Override
        public Call<Void> sendSpans(List<byte[]> encodedSpans) {
            this.spanSent = true;
            return Call.create(null);
        }

    }

}
6. Log integration
Sleuth configures the logging context with variables including the service name (%{spring.zipkin.service.name} or %{spring.application.name} if the previous one was not set), span ID (%{spanId}) and the trace ID (%{traceId}).
These help you connect logs with distributed traces and allow you choice in what tools you use to troubleshoot your services.
Once you find any log with an error, you can look for the trace ID in the message. Paste that into your distributed tracing system to visualize the entire trace, regardless of how many services the first request ended up hitting.
backend.log:  2020-04-09 17:45:40.516 ERROR [backend,5e8eeec48b08e26882aba313eb08f0a4,dcc1df555b5777b3] 97203 --- [nio-9000-exec-1] o.s.c.s.i.web.ExceptionLoggingFilter     : Uncaught exception thrown
frontend.log:2020-04-09 17:45:40.574 ERROR [frontend,5e8eeec48b08e26882aba313eb08f0a4,82aba313eb08f0a4] 97192 --- [nio-8081-exec-2] o.s.c.s.i.web.ExceptionLoggingFilter     : Uncaught exception thrown
Above, you’ll notice the trace ID is 5e8eeec48b08e26882aba313eb08f0a4, for example.
This log configuration was automatically setup by Sleuth.
You can disable it by disabling Sleuth via spring.sleuth.enabled=false property or putting your own logging.pattern.level property.
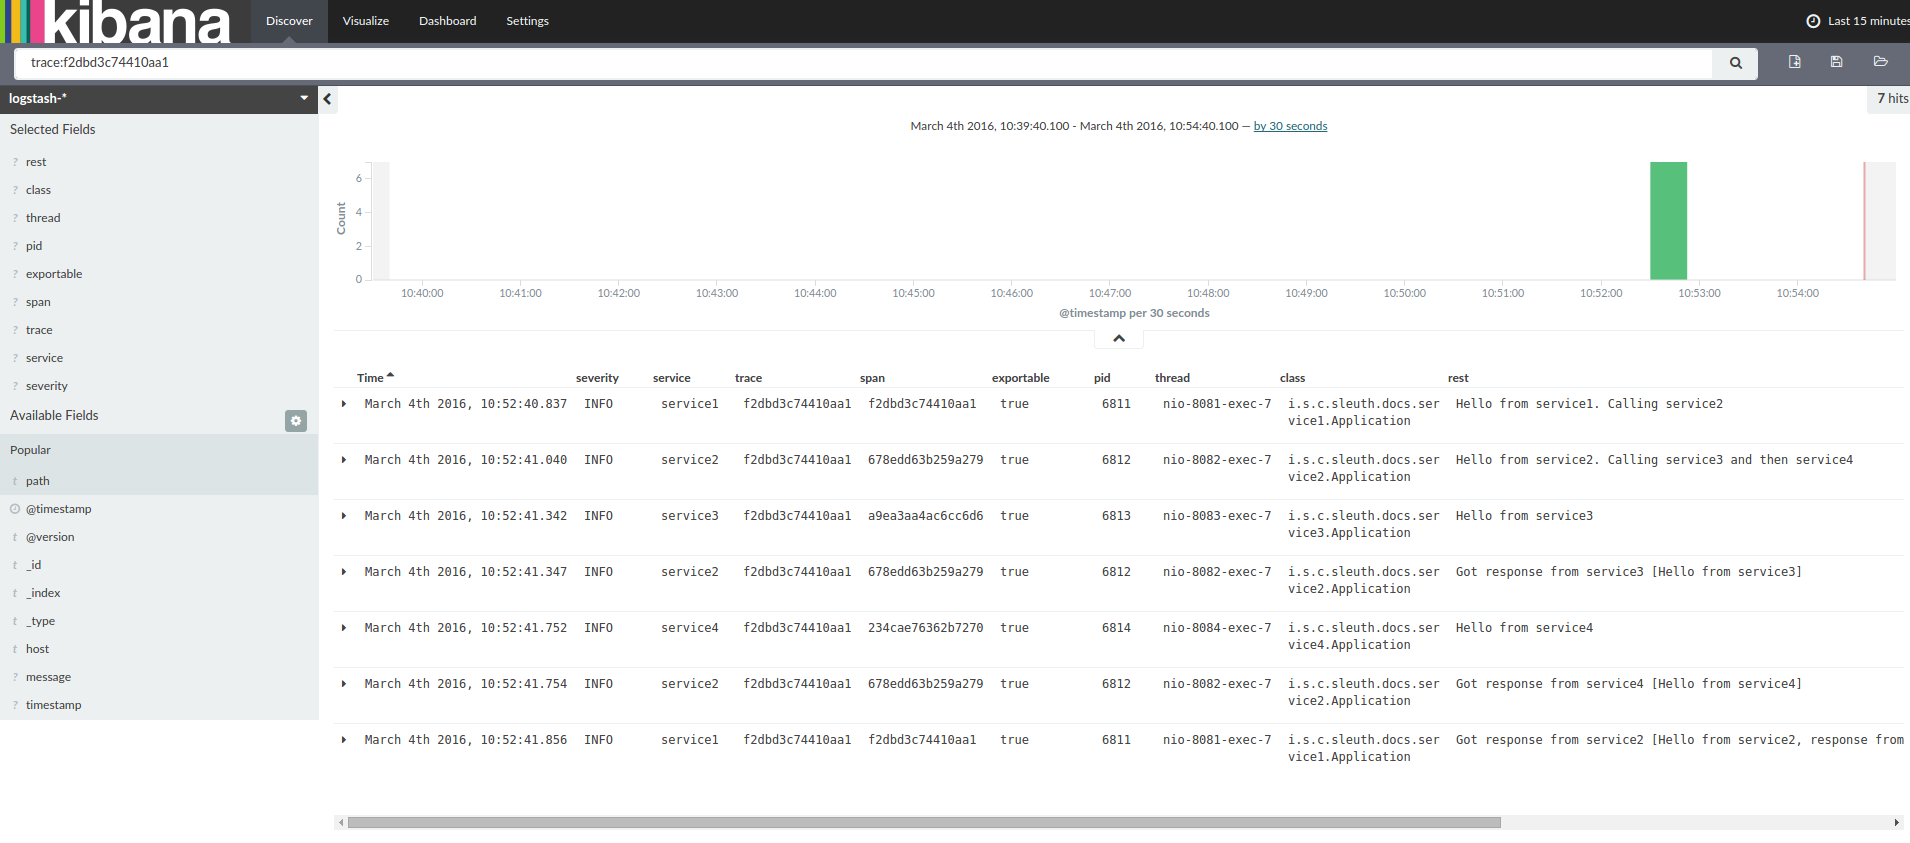
If you use a log aggregating tool (such as Kibana, Splunk, and others), you can order the events that took place. An example from Kibana would resemble the following image:
If you want to use Logstash, the following listing shows the Grok pattern for Logstash:
filter {
  # pattern matching logback pattern
  grok {
    match => { "message" => "%{TIMESTAMP_ISO8601:timestamp}\s+%{LOGLEVEL:severity}\s+\[%{DATA:service},%{DATA:trace},%{DATA:span}\]\s+%{DATA:pid}\s+---\s+\[%{DATA:thread}\]\s+%{DATA:class}\s+:\s+%{GREEDYDATA:rest}" }
  }
  date {
    match => ["timestamp", "ISO8601"]
  }
  mutate {
    remove_field => ["timestamp"]
  }
}| If you want to use Grok together with the logs from Cloud Foundry, you have to use the following pattern: |
filter {
  # pattern matching logback pattern
  grok {
    match => { "message" => "(?m)OUT\s+%{TIMESTAMP_ISO8601:timestamp}\s+%{LOGLEVEL:severity}\s+\[%{DATA:service},%{DATA:trace},%{DATA:span}\]\s+%{DATA:pid}\s+---\s+\[%{DATA:thread}\]\s+%{DATA:class}\s+:\s+%{GREEDYDATA:rest}" }
  }
  date {
    match => ["timestamp", "ISO8601"]
  }
  mutate {
    remove_field => ["timestamp"]
  }
}
6.1. JSON Logback with Logstash
Often, you do not want to store your logs in a text file but in a JSON file that Logstash can immediately pick.
To do so, you have to do the following (for readability, we pass the dependencies in the groupId:artifactId:version notation).
Dependencies Setup
-
Ensure that Logback is on the classpath (
ch.qos.logback:logback-core). -
Add Logstash Logback encode. For example, to use version
4.6, addnet.logstash.logback:logstash-logback-encoder:4.6.
Logback Setup
Consider the following example of a Logback configuration file (logback-spring.xml).
<?xml version="1.0" encoding="UTF-8"?>
<configuration>
    <include resource="org/springframework/boot/logging/logback/defaults.xml"/>
    <springProperty scope="context" name="springAppName" source="spring.application.name"/>
    <!-- Example for logging into the build folder of your project -->
    <property name="LOG_FILE" value="${BUILD_FOLDER:-build}/${springAppName}"/>

    <!-- You can override this to have a custom pattern -->
    <property name="CONSOLE_LOG_PATTERN"
              value="%clr(%d{yyyy-MM-dd HH:mm:ss.SSS}){faint} %clr(${LOG_LEVEL_PATTERN:-%5p}) %clr(${PID:- }){magenta} %clr(---){faint} %clr([%15.15t]){faint} %clr(%-40.40logger{39}){cyan} %clr(:){faint} %m%n${LOG_EXCEPTION_CONVERSION_WORD:-%wEx}"/>

    <!-- Appender to log to console -->
    <appender name="console" class="ch.qos.logback.core.ConsoleAppender">
        <filter class="ch.qos.logback.classic.filter.ThresholdFilter">
            <!-- Minimum logging level to be presented in the console logs-->
            <level>DEBUG</level>
        </filter>
        <encoder>
            <pattern>${CONSOLE_LOG_PATTERN}</pattern>
            <charset>utf8</charset>
        </encoder>
    </appender>

    <!-- Appender to log to file -->
    <appender name="flatfile" class="ch.qos.logback.core.rolling.RollingFileAppender">
        <file>${LOG_FILE}</file>
        <rollingPolicy class="ch.qos.logback.core.rolling.TimeBasedRollingPolicy">
            <fileNamePattern>${LOG_FILE}.%d{yyyy-MM-dd}.gz</fileNamePattern>
            <maxHistory>7</maxHistory>
        </rollingPolicy>
        <encoder>
            <pattern>${CONSOLE_LOG_PATTERN}</pattern>
            <charset>utf8</charset>
        </encoder>
    </appender>
    <!-- Appender to log to file in a JSON format -->
    <appender name="logstash" class="ch.qos.logback.core.rolling.RollingFileAppender">
        <file>${LOG_FILE}.json</file>
        <rollingPolicy class="ch.qos.logback.core.rolling.TimeBasedRollingPolicy">
            <fileNamePattern>${LOG_FILE}.json.%d{yyyy-MM-dd}.gz</fileNamePattern>
            <maxHistory>7</maxHistory>
        </rollingPolicy>
        <encoder class="net.logstash.logback.encoder.LoggingEventCompositeJsonEncoder">
            <providers>
                <timestamp>
                    <timeZone>UTC</timeZone>
                </timestamp>
                <pattern>
                    <pattern>
                        {
                        "timestamp": "@timestamp",
                        "severity": "%level",
                        "service": "${springAppName:-}",
                        "trace": "%X{traceId:-}",
                        "span": "%X{spanId:-}",
                        "pid": "${PID:-}",
                        "thread": "%thread",
                        "class": "%logger{40}",
                        "rest": "%message"
                        }
                    </pattern>
                </pattern>
            </providers>
        </encoder>
    </appender>
    <root level="INFO">
        <appender-ref ref="console"/>
        <!-- uncomment this to have also JSON logs -->
        <!--<appender-ref ref="logstash"/>-->
        <!--<appender-ref ref="flatfile"/>-->
    </root>
</configuration>
That Logback configuration file:
-
Logs information from the application in a JSON format to a
build/${spring.application.name}.jsonfile. -
Has commented out two additional appenders: console and standard log file.
-
Has the same logging pattern as the one presented in the previous section.
If you use a custom logback-spring.xml, you must pass the spring.application.name in the bootstrap rather than the application property file.
Otherwise, your custom logback file does not properly read the property.
|
7. What to Read Next
If you want to learn more about any of the classes discussed in this section, you can browse the source code directly. If you have specific questions, see the how-to section.
If you are comfortable with Spring Cloud Sleuth’s core features, you can continue on and read about Spring Cloud Sleuth’s integrations.