Spring Tool Suite 3.7.1: New and Noteworthy
General Updates
Eclipse Mars.1 (4.5.1, formerly known as Mars SR1)
The default STS distribution is now based on the recently released Eclipse Mars.1 release, formerly known as Eclipse Mars SR1. This update includes important fixes for the Java8 compiler implementation and the Maven Integration for Eclipse (that broke the Groovy-Eclipse m2e configurator in m2e 1.6.1), plus other bug fixes. If you want to know what is new in Eclipse Mars in general, read more at Eclipse Mars New & Noteworthy.
Pivotal tc Server updated to 3.1.2
The latest Pivotal tc Server release 3.1.2 is now included in the STS distribution bundle.
Spring Tooling
Spring Boot Dashboard (for microservice development, in beta)
Micro service architectures are becoming increasingly popular - utilising Spring Boot for each individual service and then Spring Cloud to help those services communicate and coordinate. To help developers working in these configurations where there are typically more apps to manage than they may be used to (some running locally, some up on the Cloud), we have created the Spring Boot Dashboard in STS.
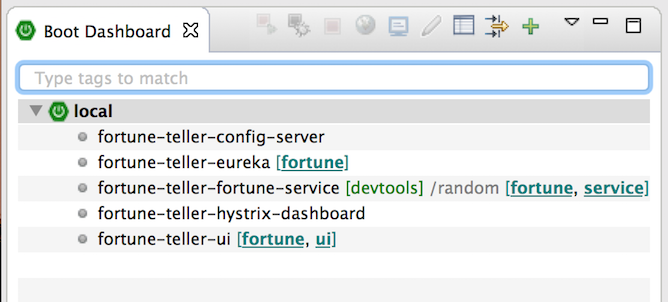
You can open the Spring Boot Dashboard via the Spring Boot button in your main Eclipse toolbar.
It opens up a new view in your STS/Eclipse. If you have projects in your workspace that use Spring Boot, you will see them showing up in the boot dashboard automatically.
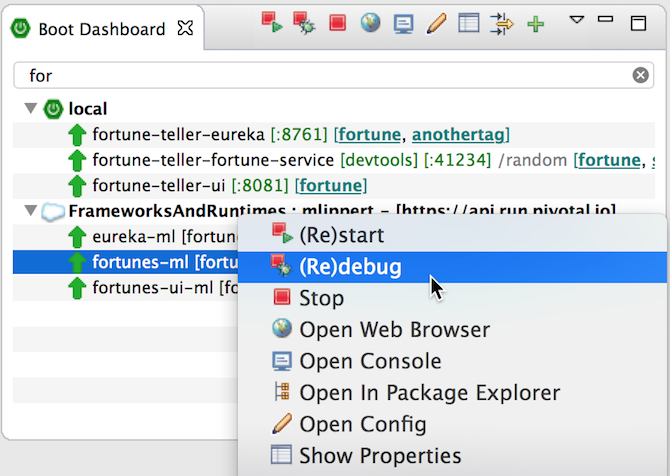
You can select one or many apps, then start or stop them using the actions in the toolbar of the view or from the context menu. This gives you an easy way to just start (in debug or run mode) or stop them right from within the boot dashboard. Those actions will take care of an already running app and restart it (stop it first, then start it again) for you. This makes it easy for you to quickly restart your boot app, if you made changes to your code, for example.
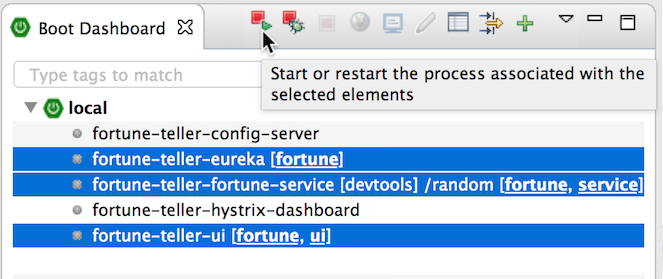
The (re)start/(re)debug actions will create a new Spring Boot launch configuration, if there is no existing Spring Boot launch configuration for the project. If there are multiple launch configurations available, the dashboard allows you to select the default one. This will be used the next time you press (re)start/(re)debug on the dashboard.
If you are looking for the console of a running boot app, you can jump to that console directly from within the boot dashboard. This makes it easy to switch between the different consoles if you have a number of boot apps running locally.
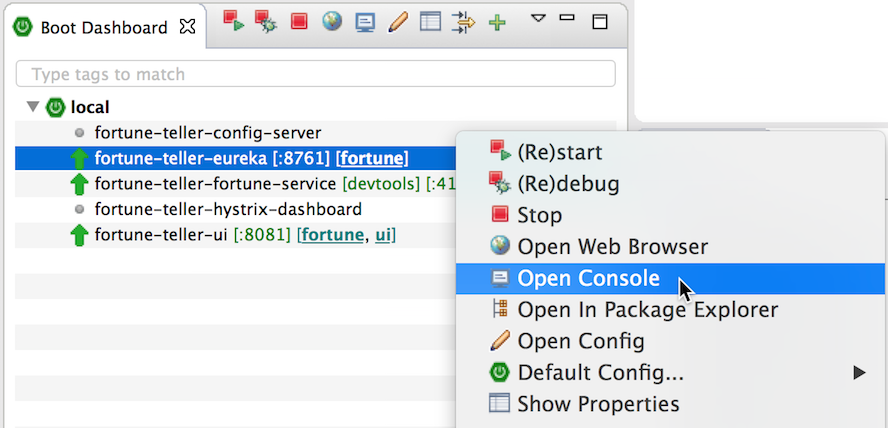
For developer convenience some information is directly displayed in the boot dashboard for each app, if the app is running. First of all, the state is visualized using icons for inactive, starting, or running spring boot projects. The boot dashboard will also display the port that is used by the boot app - no more searching through the console or your property files. Note: some features of the dashboard like port discovery need a very recent version of boot (1.3)
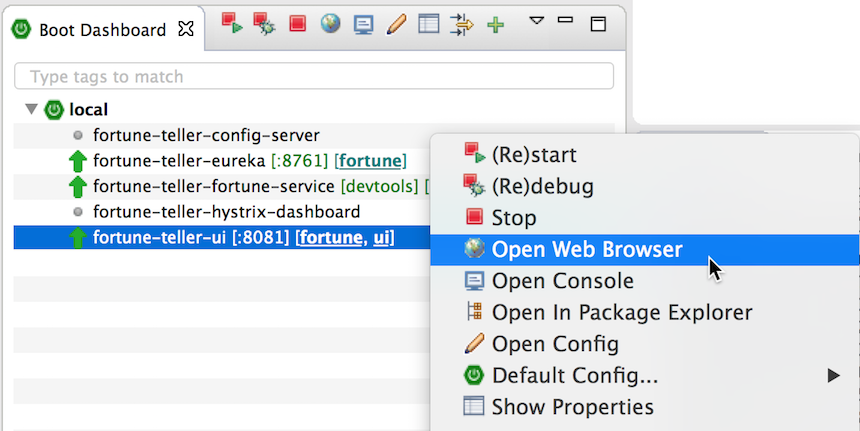
If you would like to access the running spring boot application via a browser, you can just double-click on the project item in the boot dashboard. It will open a browser with the default URL (in this case it is localhost, followed by the port number of the app) for you. This feature uses the preferences for which browser to use from the general STS/Eclipse browser preferences. So if you would like to use your system default instead of the internal STS/Eclipse browser view, go to the preferences and make the switch. The next time you double-click on a running project in the boot dashboard it will use that setting.
In some situations, the default URL of a project is not what you typically use as the main entry point of your app. Sometimes there is no default page being served, but specific request mappings are used to return JSON data, for example. For those situations, you can customize the default URL of the app (for the double-click action). Open the properties view for the item in the dashboard (there is an action for that in the dashboard, too) and type something into the "path" field. This will be used as the extension to the default URL of the app. From there on, a double-click will open this combined URL.
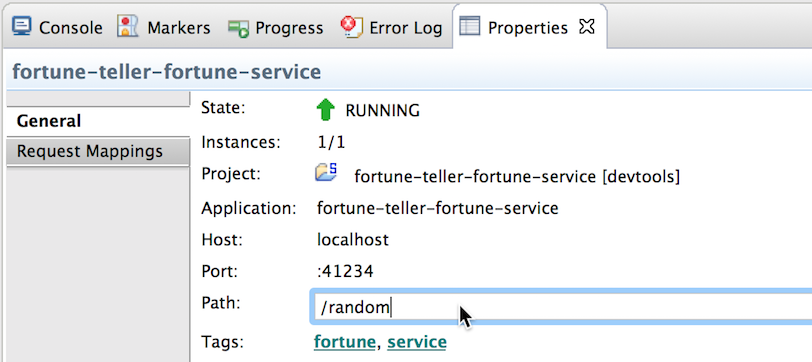
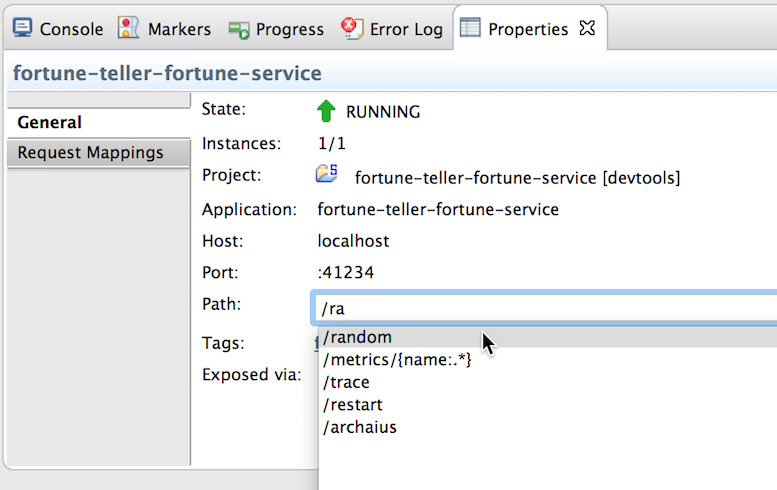
If you have the Spring Boot actuators enabled for your Spring Boot projects (by adding them as a starter in your pom.xml file), the path field will even prompt you with content assist. It finds all the mapped URLs of the running Spring Boot app.
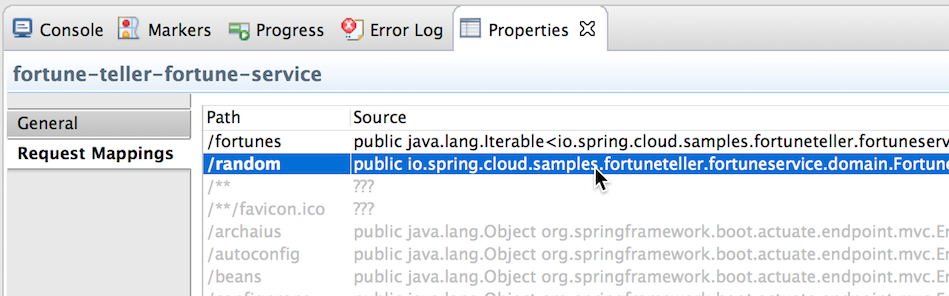
You can browse them in the "Request Mappings" section of the properties view as well. In that tab of the properties view, every single request mapping of the running app is listed. The ones at the top (using a regular font color) are defined in the source code of your project. The ones in grey are contributed by libraries on the classpath of the project. Double-clicking on the URL extension opens a browser window for that mapping. Double-clicking on the source-code column of that entry will jump to the code where this request mapping is being defined. This makes it easy for you to navigate to the code directly from the request mapping.
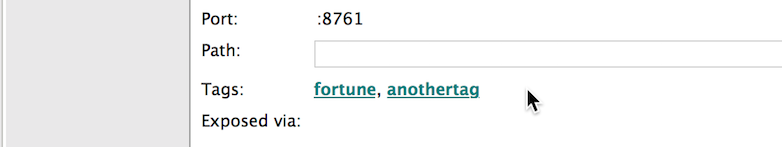
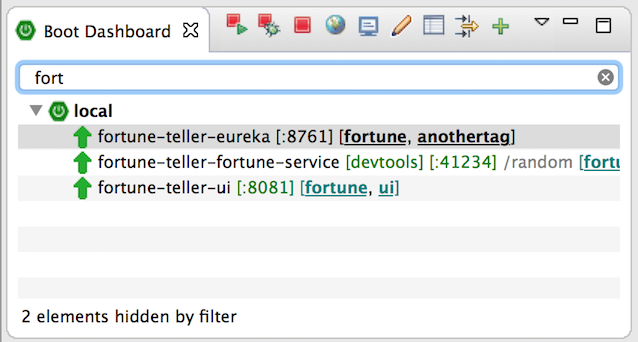
Working with a potentially larger number of Spring Boot applications in your workspace can turn the Spring Boot dashboard into a crowded place. Usually in those situations you are not working on all of those projects, but would like to focus in on a subset. Therefore we added the ability to tag boot apps on the dashboard. Within the propperties view the field "tags" allows you to add any number of tags to each project. Content-assist helps you to use already existing tags. A comma or a semicolon can be used as a delimiter to distinguish individual tags, since we allow spaces to be part of a tag.
Once tagged, you can go back to the boot dashboard and use the filter box at the top to reduce the number of visible projects to just those having certain tags. In case your tag doesn't match all the apps, there is an information label showing up at the botton of the dashboard about how many projects are currently not visible due to the filtering.
These features are great for dealing with local Spring Boot apps and definitely provide the easiest way to work with them. From our early experiences using the dashboard and watching people using it, it changes the way you work with Spring Boot apps in STS.
Cloud-native applications are rarely developed exclusively on a local machine. It is a common occurrence that your system is composed of numerous microservices and you may be working locally on one of them whilst the rest are deployed to the cloud. To make managing cloud deployment easier the boot dashboard integrates Cloud Foundry support directly.
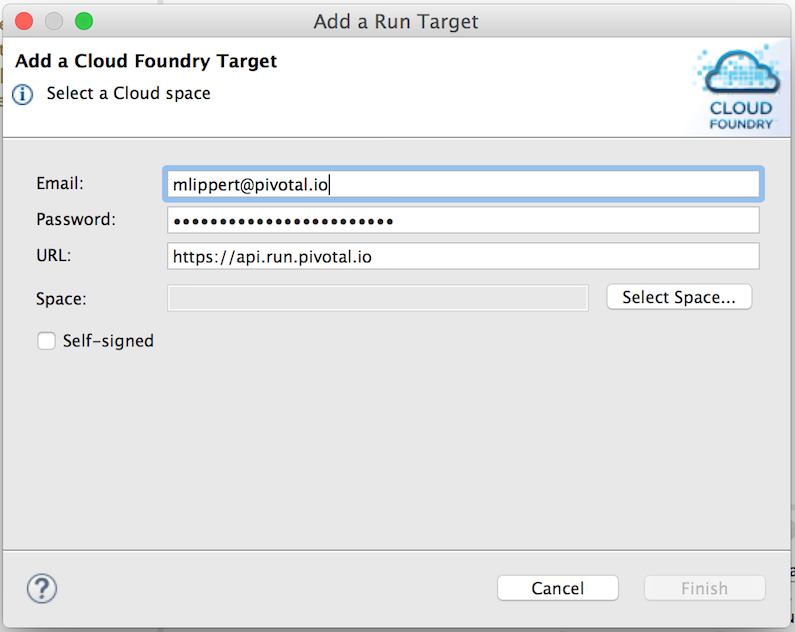
You can use the big "plus" icon from the toolbar or the context menu to add a new section for Cloud Foundry to your boot dashboard. The dialog that appears allows you to specify your credentials and the Cloud Foundry instance of your choice. Once that information is entered, you can select the org and space that you would like to use in this Cloud Foundry section in the boot dashboard.
Feel free to add multiple Cloud Foundry sections to your boot dashboard in case you would like to use different Cloud Foundry instances or different orgs/spaces from the same Cloud Foundry instance. Just open the dialog again and add another section.
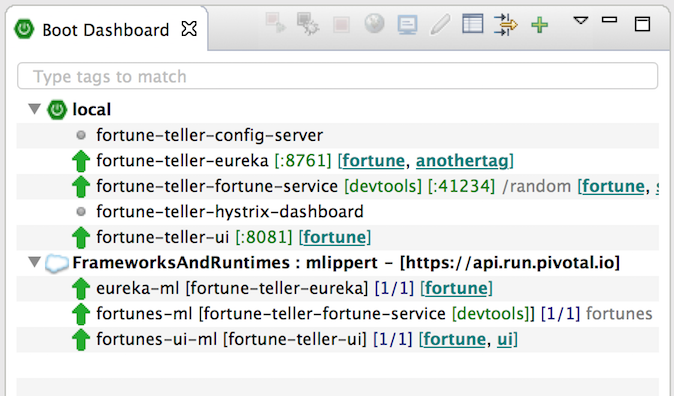
Once added, the section in the boot dashboard will list the apps that are deployed on this cloud foundry space, together with their state (running, starting, or inactive), and the number of instances. The same actions (start, stop, open console) are supported for Cloud Foundry deployed apps as are supported for local boot apps.
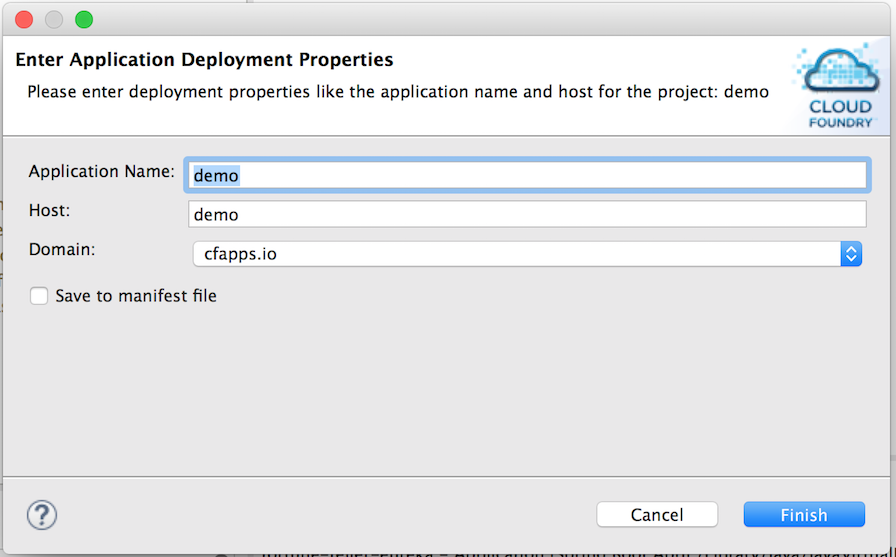
You can also deploy one Spring Boot project (or even multiple at the same time) from your workspace to Cloud Foundry using drag&drop. The boot dashboard will either use the manifest.yml file of the project to configure it for CF or will prompt you for necessary information about the project in order to facilitate deployment.
But take care when using a manifest.yml file in your project. If there is one, the boot dashboard will use it to configure the application on CF each time you redeploy it (which happens automatically when executing restart/redebug). Changes to your application on CF that you made elsewhere (via the CF CLI or the web console) will be lost and overridden by the configuration inside the manifest.yml. Even though this provides a consistent behavior of the boot dashboards interactions with CF, we know that this is not yet the optimal way to do it and is something we will work on for the next version of the boot dashboard.
Once you have deployed an app from your workspace to CF, the boot dashboard will keep this project association. If you, for example, change the code of your project locally and press (re)start afterwards on the associated app on CF, the boot dashboard will take care of redeploying the modified app to CF before it restarts it.
You might have noticed that turn-around-cycles can be rather long when working with apps that are deployed to CF somewhere. Changing the app locally usually requires uploading the changes to CF and re-staging/starting the app on CF. The Spring Boot Devtools help you with that. They allow an automatic restart of a Spring Boot application when class files change. In contrast to redeploying an app on CF, the internal Spring Boot mechanism to restart the app usually takes only a few seconds.
Usually this is done by starting the Spring Boot app on CF with the Spring Boot devtools on its classpath as well as a few options to enable the automatic restart of the app in a remote context. In addition to that the local Spring Boot app in your workspace needs to be started with a specific main method and additional options as well to act as a local file watcher and submit changes ot the app on CF. The boot dashboard provides direct support for this setup. In case an app has the Spring Boot Devtools on its classpath, all the necessary options are enabled by default at deploy time. And a context menu action allows the developer to start the local app using a single click.
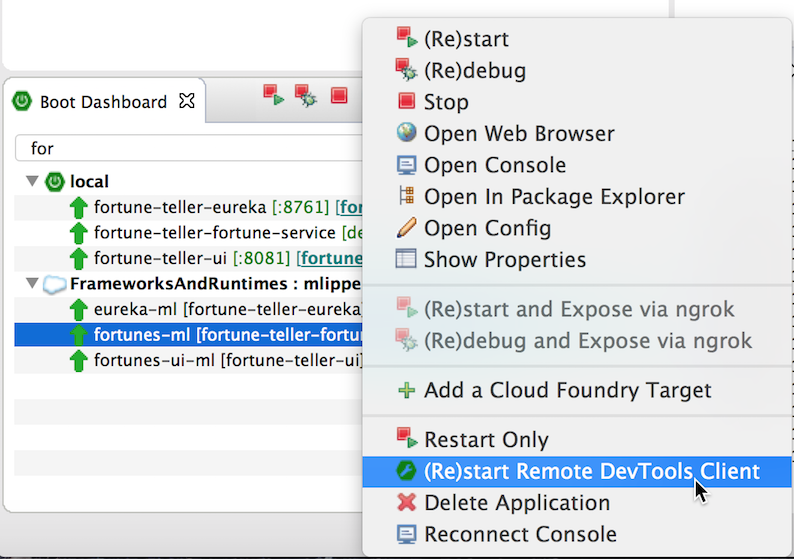
This makes it easy and convenient to work with the Spring Boot Devtools on CF. Additionally, the Spring Boot Devtools allow remote debugging of apps on CF. And the boot dashboard supports this as well. You can restart your boot-devtools-enabled app on CF in debug mode (using the (re)debug action). The boot devtools client application is started automatically and the STS/Eclipse debugger is connected to that application, once it is up and running.
This allows you to debug applications on CF right from within your IDE. (the automatic restart feature is automatically disabled when running the app in debug mode, since both features cannot yet be used at the same time.
Even though this remote debugging is a powerful feature for cetain situations, it usually is too slow for your everyday debugging work. Therefore the boot dashboard offers another option to work with applications on remote targets like CF. The boot dashboard allows you to run a local Spring Boot app and expose it via the ngrok service to the internet. This creates a public visible URL at ngrok that forwards all traffic to your locally running application.
At the same time, when starting the local app in this mode, you can choose a remote Eureka service registry on CF, for example, to register your service with. The local app will be started with additional parameters to register with the remote Eureka instance using the URL of the public visible ngrok tunnel. As a result, services and apps on CF that lookup your service via Eureka are now able to call out to your locally running service. This enables you to run one of your microservices locally (and debug it, for example, locally), while everything else of your microservice landscape continues to run on CF!
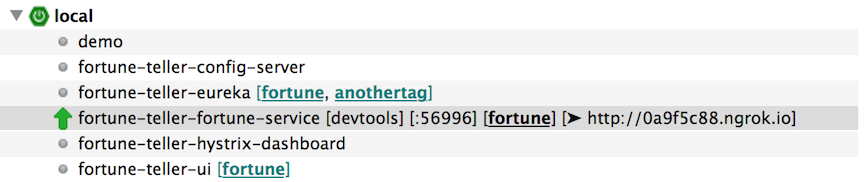
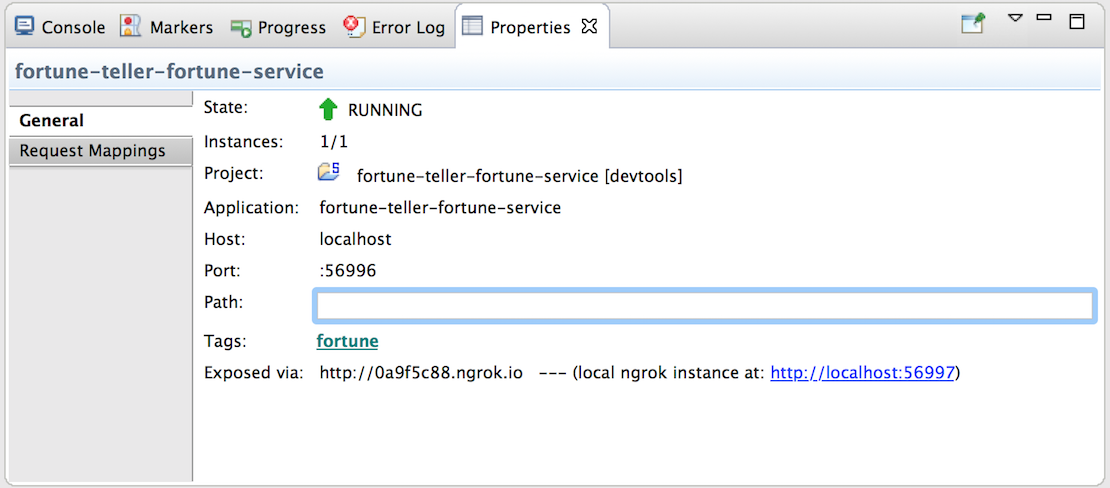
The information about the exposed ngrok tunnel is displayed in the boot dashboard and visible in the properties view when you select the local app in the boot dashboard. There is also a link to the admin UI of the locally running ngrok service (which is started behind the scenes for the exposed app automatically). This ngrok UI is quite useful for introspecting the calls that are going forth and back via the tunnel.
We hope you like the dashboard. If you have suggestions/questions, feel free to contact us on StackOverflow or via our issue tracker (see below).
Improvements to the Spring Boot YML and Properties Editors
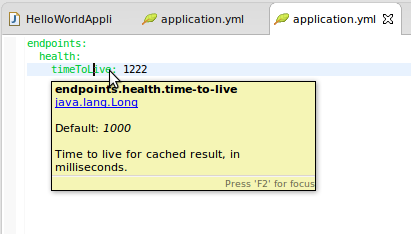
The Spring Boot YML editor now fully understands property names written in camel-case. (Note: The properties editor also understands camel-case, but that is not new in this release)
Both the Yaml and Properties editor provide two new quickfixes to resolve 'unknown property' warnings:
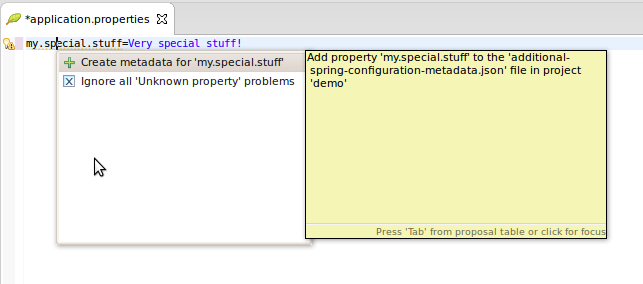
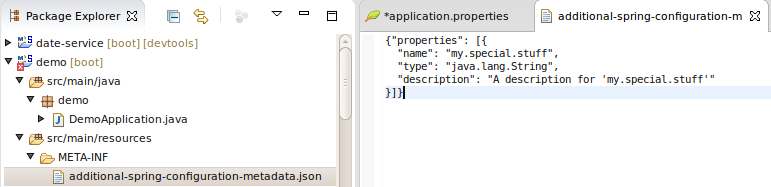
The first quickfix will create additional metadata (see the Spring Boot Docs for detailed information about the metadata format). You will be prompted for a place to create a custom metadata file if one doesn't already exist in your project. After applying the quickfix, the property will immediately be known to the editor as a property of type String. You can edit the generated metadata to customize it further, for example, to provide a better description or more accurate type information.
The second quickfix to "Ignore all 'Unknown property' problems" simply turns off all checking for this particular type of problem through a workspace-wide preference. Should you change your mind later, you can turn it back on from the Spring Properties Editor Preferences page:
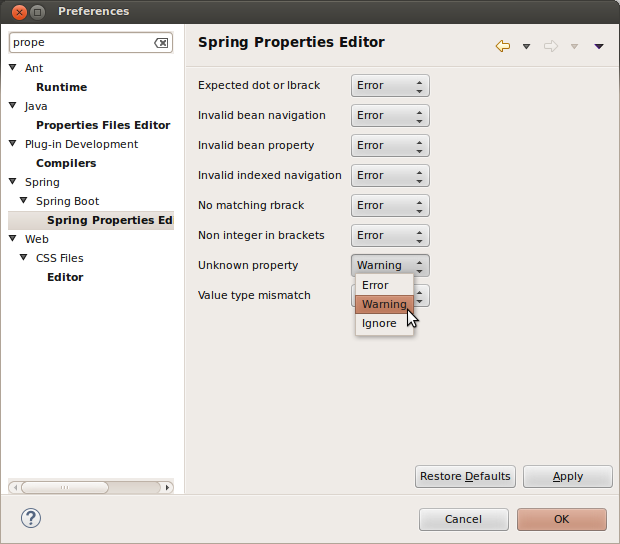
Note that the yaml editor also has a similar looking preferences page to configure error/warning levels for problems in the Yaml editor. Both editors are configured independently because they check for slightly different types of problems.
GGTS
Since the end of March Pivotal is no longer sponsoring the Groovy and Grails projects (as described here). Therefore we don't ship new versions of the GGTS bundle anymore. Groovy-Eclipse remains on the dashboard and was fully updated for Eclipse 4.5. It was *not* updated for Eclipse 4.5.1 so beware that if you install Groovy-Eclipse you will be downgrading your Java compiler and missing all the JDT related fixes that went into 4.5.1.
Miscellaneous
Issues resolved in this release
Here is a full list of resolved bugs and enhancement requests for 3.7.1:
Useful Links
Download STS: https://spring.io/tools/sts/all
STS Issue tracker: https://issuetracker.springsource.com/browse/STS
Known issues in this release
Error after updating from STS 3.7.0
Sometimes after updating an existing STS 3.7.0 installation to 3.7.1 an error dialog pops up and STS doesn't start. This is a known but not yet solved problem. If you come across this issue, please press "OK" on the dialog and restart STS. It will open up fine, including all the updated components.
No repository available when checking for updates
If you have used a pre-release version of Eclipse Mars or STS, the embedded Eclipse Oomph technology created a cache of p2 repositores in your home directory. This cached p2 data can cause issues when using STS 3.7.0 or Eclipse Mars. The error message looks like STS/Eclipse fails to read information from the main Eclipse Mars p2 repository.
In case you encounter this error, please stop Eclipse/STS, go to your home directory, delete "~/.eclipse/org.eclipse.oomph.p2", and restart Eclipse/STS. The related Eclipse bug is: Bug 470912.
Live configuration-metadata generation requires Spring Boot 1.2.2
Spring Boot 1.2.1 configuration processor does not work correctly when executed from Eclipse's incremental build. This issue is fixed in Spring Boot 1.2.2. This only affects 'live' metadata generated from your own source code, not the metadata that is packaged inside spring-boot jars themselves. So you can still use older versions of Boot, but the 'live metadata' updates will not be accurate. See Spring Boot issue GH-2313 for details.
Dashboard and Retina Displays
When running STS on top of a JDK7, the new dashboard looks a bit blurry when using a HiRes (Retina) display, for example on a Retina MacBook Pro. This is due to the underlying browser technology that is used to display the dashboard content and that is coming from JavaFX. The JavaFX version that ships with JDK7 doesn't support retina displays. The solution for this is to run STS on top of a JDK8 build. The JavaFX version that comes with JDK8 supports retina displays.
Setting the JDK
STS requires a JDK to run on top of. Nevertheless the native launcher component might pick up a JRE automatically if you don't specify which JDK to run STS on top of. To avoid this, you can specify the JDK in the sts.ini file that comes with your STS installation. Add a line at the beginning "-vm" and an additional line below that which points to the "javaw" executable of the JDK on your machine.
Issues on Linux (GTK3)
Eclipse 4.5, upon which STS and GGTS are based, is the first Eclipse release where GTK3 is the default for the SWT widget library. There are some issues with this still:
- STS New Dashboard doesn't work under GTK3 because it uses JavaFX which is not currently compatible with GTK3. Instead the old dashboard will open.
- The Eclipse editor may be slow to respond (Eclipse Bug 434898).
You may also experience other UI rendering glitches. If you exprience any of these problems you can avoid them by forcing SWT to switch back to using GTK2. Just set the environment variable "SWT_GTK3=0" before launching STS or GGTS.