The Spring Cloud Data Flow server is a Spring Boot application that includes the Actuator library, which adds several production ready features to help you monitor and manage your application.
The Actuator library adds http endpoints under the context path /management that is also
a discovery page for available endpoints. For example, there is a health endpoint
that shows application health information and an env that lists properties from
Spring’s ConfigurableEnvironment. By default only the health and application info
endpoints are accessible. The other endpoints are considered to be sensitive
and need to be enabled explicitly via configuration. If you are enabling
sensitive endpoints then you should also
secure the Data Flow server’s endpoints so that
information is not inadvertently exposed to unauthenticated users. The local Data Flow server has security disabled by default, so all actuator endpoints are available.
The Data Flow server requires a relational database and if the feature toggled for
analytics is enabled, a Redis server is also required. The Data Flow server will
autoconfigure the DataSourceHealthIndicator and RedisHealthIndicator if needed. The health of these two services is incorporated to the overall health status of the server through the health endpoint.
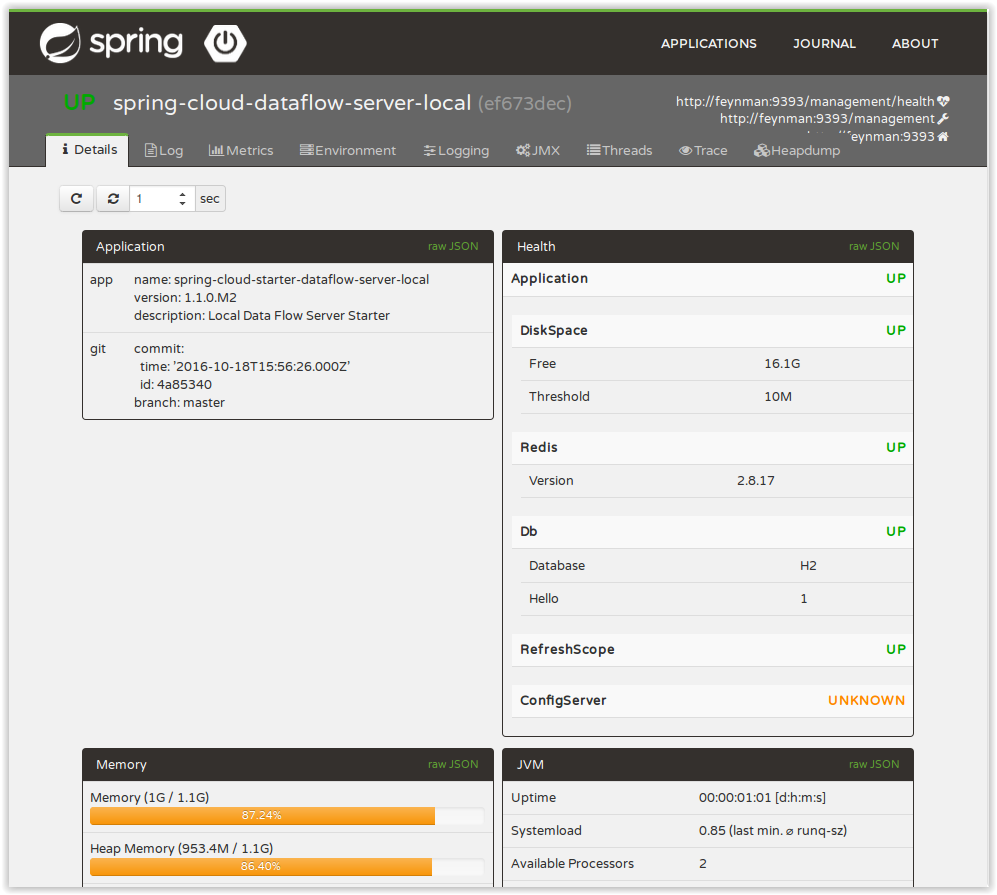
A nice way to visualize and interact with actuator endpoints is to incorporate the Spring Boot Admin client library into the Spring Cloud Data Flow server. You can create the Spring Boot Admin application by following a few simple steps.
An easy way to include the client library into the Data Flow server is to create a new Data Flow Server project from start.spring.io. Type 'flow' in the "Search for dependencies" text box and select the server runtime you want to customize. A simple way to have the Spring Cloud Data Flow server be a client to the Spring Boot Admin Server is by adding a dependency to the Data Flow server’s pom and an additional configuration property as documented in Registering Client Applications.
This will result in a UI with tabs for each of the actuator endpoints.
Additional configuration is required to interact with JMX beans and logging levels. Refer
to the Spring Boot admin documentation for more information. As only the info
and health endpoints are available to unauthenticated users, you should enable security on
the Data Flow Server and also configure Spring Boot Admin server’s security so that it
can securely access the actuator endpoints.
The applications that are deployed by Spring Cloud Data Flow are based on Spring Boot which contains several features for monitoring your application in production. Each deployed application contains several web endpoints for monitoring and interacting with Stream and Task applications.
In particular, the metrics endpoint contains counters and gauges for HTTP requests, System Metrics (such as JVM stats), DataSource Metrics and Message Channel Metrics (such as message rates). In turn, these metrics can be exported periodically to various application monitoring tools via MetricWriter implementations. You can control how often and which Spring Boot metrics are exported through the use of include and exclude name filters.
The project Spring Cloud Data Flow Metrics provides the foundation for
exporting Spring Boot metrics. The main project provides Spring Boots AutoConfiguration to setup the exporting process and common
functionality such as defining a metric name prefix appropriate for your environement. For example, you may want to include the
region where the application is running in addition to the application’s name and stream/task to which it belongs.
The main project also includes a LogMetricWriter so that
metrics can be stored into the log file. While very simple in approach, log files are often ingested into application monitoring tools
(such as Splunk) where they can be further processed to create dashboards of an application’s performance.
The project Spring Cloud Data Flow Metrics Datadog Metrics provides integration to export Spring Boot metrics to Datadog.
To make use of this functionality, you will need to add additional dependencies into your Stream and Task applications. To customize the "out of the box" Task and Stream applications you can use the Data Flow Initializr to generate a project and then add to the generated Maven pom file the MetricWriter implementation you want to use. The documentation on the Data Flow Metrics project pages provides the additional information you need to get started.